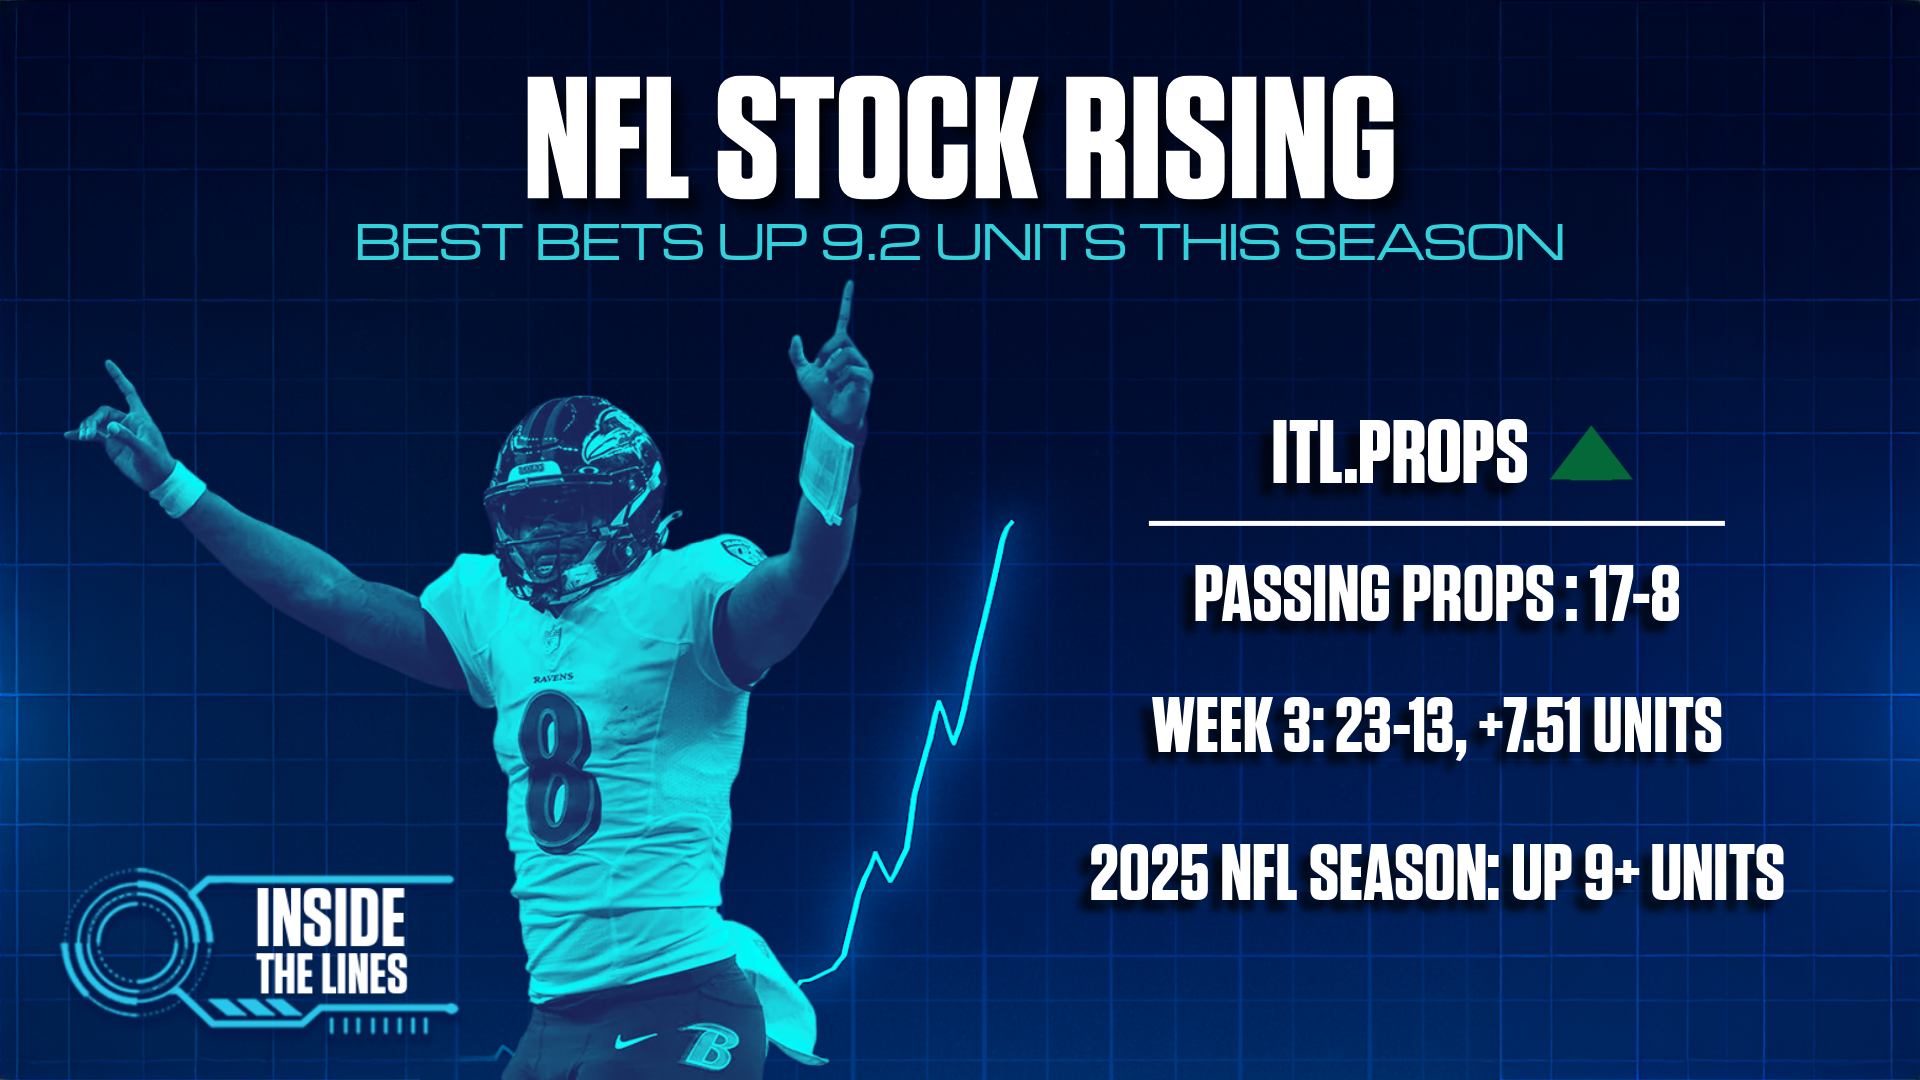
Inside the Lines rising: Best bets up 9.2 units heading into NFL Week 4, led by 17-8 mark on passing props

The SportsLine Projection Model was developed and powered by the Inside the Lines team. You can find all of our team’s picks and content at our blog, which has all our personal best bets for free. We also have picks for Thursday Night Football’s Seattle at Arizona game ready to go.
I’m putting in a call out for BetMGM right out of the gate because of the table down below that shows they have offered the best price in 33 of our 96 best bets and account for basically 100% of our profit!
Strong Early Returns in the NFL
Thanks to a killer Week 3, we have generated over 9 units of profit and have been especially strong on our reception props, going 7-3, +4.6.
| WEEK | RIGHT | WRONG | UNITS |
| 1 | 12 | 12 | -0.71 |
| 2 | 20 | 16 | 2.38 |
| 3 | 23 | 13 | 7.51 |
| ALL | 55 | 41 | 9.18 |
Our passing props have also been strong, with a combined 12-4 record on passing yards, passing touchdowns, pass attempts and completion props. Our pass interception props drag down the category slightly at 5-4. The ever popular Anytime Touchdown bets are down for the season but went 6-3 in Week 3.
| MARKET | RIGHT | WRONG | UNITS |
| REC | 7 | 3 | 4.64 |
| UNDER | 3 | 0 | 2.74 |
| PASSYD | 4 | 1 | 2.52 |
| PASSTD | 6 | 3 | 2.48 |
| ML | 2 | 0 | 1.74 |
| PASS | 1 | 0 | 0.88 |
| COMP | 1 | 0 | 0.76 |
| RUSH | 3 | 2 | 0.37 |
| OVER | 1 | 1 | -0.09 |
| RECYD | 4 | 4 | -0.53 |
| PASSINT | 5 | 4 | -0.57 |
| ATD | 9 | 10 | -0.62 |
| RUSH+RECYD | 1 | 2 | -1.13 |
| PS | 5 | 6 | -1.65 |
| RUSHYD | 3 | 5 | -2.35 |
| ALL | 55 | 41 | 9.19 |
Shopping Around is a Must
They both have offered the best price in a fair number of times and we are profitable on the platforms. We cover all major bet types and some lines, especially ATDs might be as high as +400 and some as low as -200. I translated all of our best lines to implied percentages and then generated the average betting line for each book.
You see that on average our line is -106, which is not only better than the industry standard -110 juice, it’s probably much better than the average prop bet over/under juice and by shopping around we probably earned ourselves an extra 1.5 units.
| MARKET | RIGHT | WRONG | UNITS | AVG LINE |
| BETMGM | 22 | 11 | 9.07 | -110 |
| CONS | 2 | 0 | 1.78 | -112 |
| CAESARS | 4 | 2 | 1.40 | -120 |
| FD | 12 | 9 | 1.31 | -110 |
| DK | 10 | 9 | 1.20 | 106 |
| BETRIVERS | 0 | 1 | -1.00 | -103 |
| HR | 0 | 2 | -2.00 | 112 |
| FANATICS | 5 | 7 | -2.57 | -111 |
| ALL | 55 | 41 | 9.19 | -106 |
The big boys, FanDuel and DraftKings, have been perfectly kind to us with us.
I wish Caesars would stick their neck out more often but they tend to play it ‘middle of the road’ and rarely offer a best priced line.
Fanatics has not delivered us a very positive experience so far, but there’s plenty of time to make up for it.
What makes a bet an “Inside the Lines Best Bet?”
Our model is different than most. We don’t try to accurately forecast who is going to cover or what props are going to go over/under. Over two decades, we have reverse engineered oddsmakers’ models which has resulted in 85-90% of our projections being virtually identical to the oddsmaker’s lines. When top sportsbooks‘ lines differ from ours, we know they are likely manipulating a line to generate monetary value or minimize risk. And more often than not, betting a line that is statistically sound is the better side.
In other words Inside the Lines provides ‘honest’ odds that the books would offer if they were non profit sportsbooks looking to balance $$$ evenly on both sides.
In our world there is no such thing as a “lock”. If you imagine a bell curve of outcomes, most cappers look to pick one tail or the other. We look to see if the median is off by 10% or more, identify the reasons why the line is off and if we like our reasons more than the oddsmakers’ we identify it as good value. We then look across sportsbooks to see if one is especially off (maybe 15%) and try to jump on that line before it moves.
The approach allows you to go from breaking even on standard -110 bets at 52.4% to turning a +24 unit profit if you can average a 5% better price.
Our best bets are ones where:
1) Best Projection: Our SportsLine Model’s projection shows clear value versus the line and we love certain statistical trends, X’s and O’s and subjective supporting data that supports our side but isn’t directly factored into the model. For example, say we love a running back to go Over 14.5 carries and his backup is projected for 5.5 carries, but the backup is questionable and there’s a chance he can be ruled out, which surely will change our projection to 16.5 (third-stringer gets 3.5) and the line would likely go from 12.5 to 15.5. If we have value on a side and the only unknown factors that will change are in our favor, we’ll consider it our “Best Projection.”
AND
2) Best Price: There is an outlier best price that we should take advantage of before it steams in “our direction.” In most of these cases, the best-priced book is using “standard odds making logic” to set the line, but our team has identified a unique situation where standard odds rules don’t apply. For example, maybe a player is -110 to throw an interception, but in his last three seasons he has averaged just 0.4 interceptions on the road compared to 0.7 at home because the team plays on a fast track at home and averages 5+ more pass attempts at home.
Step 1 provides greater accuracy and Step 2, especially when combined with a nice Profit Boost or Promotion, significantly lowers the bar for being profitable … which is why we like to feature our best line sportsbooks offers.


