Revealing a coherent cell-state landscape across single-cell datasets with CONCORD

The CONCORD framework
Analyses of single-cell sequencing data suggest that gene expression is not randomly sampled; rather, gene-regulatory mechanisms impose strong constraints, producing dynamically changing gene coexpression patterns reflected as intricate structures in the low-dimensional embedding of cells1,2,3,30. For example, at homeostasis, cells typically form discrete clusters corresponding to stable types or states, with adjacent clusters representing closely related states (Fig. 1a, left). In developmental or pathological contexts—such as early embryogenesis, tissue repair or tumorigenesis—cells often follow branching trajectories from progenitors to terminal fates, with semistable intermediate states forming denser clusters (Fig. 1a, middle). Cyclic gene expression programs, such as those regulating the cell cycle, give rise to loop-like structures3,31 (Fig. 1a, right).
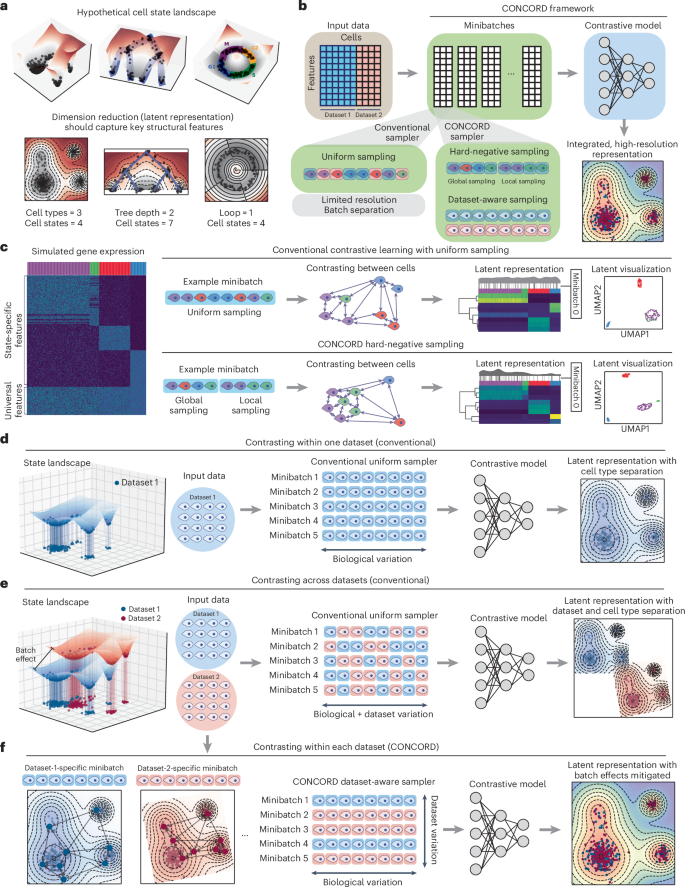
a, Schematic of hypothetical cell-state landscapes and corresponding low-dimensional representations that capture key structural features. b, Overview of the CONCORD framework, which replaces the conventional minibatch sampler with a joint hard-negative and dataset-aware sampling scheme, enabling integrated, high-resolution representation learning with a minimalist contrastive model. c, Uniform versus hard-negative sampling in a simulated four-state dataset. Heat maps show simulated expression and latent space, accompanied by density curves with black lines indicating the distribution of cells in an example minibatch under each scheme. Resulting UMAP embeddings are shown. d, Contrastive learning on a single dataset using the conventional uniform sampler, which draws cells uniformly from the entire dataset to form minibatches. e, Standard contrastive learning mixes cells from different datasets within minibatches, amplifying batch effects in the resulting latent embedding. f, CONCORD mitigates batch effects by predominantly contrasting cells within each dataset and randomly shuffling minibatches during training.
To capture these intricate structures, CONCORD uses contrastive learning with a minibatch sampling strategy that differs from conventional uniform sampling (Fig. 1b). First, to enhance resolution, we adopt hard-negative sampling32, where each minibatch is enriched with closely related cells (Fig. 1c), encouraging the model to extract features that distinguish these ‘hard negatives’. We implemented two variants of this approach: a k-nearest neighbor (kNN)-based sampler, inspired by and extending previous work33, and the hcl mode originally proposed by Robinson et al.32. The kNN-based sampler probabilistically draws cells from both their local neighborhoods and the global distribution. Local sampling—guided by a coarse graph approximation of the cellular state landscape—compels the model to contrast each cell with its neighbors, enabling detection of subtle differences between closely related states. Simultaneously, global sampling preserves a broad perspective of major cell types, ensuring robust encoding of large-scale distinctions. By iteratively presenting the model with local neighborhoods (for example, T cells in one minibatch and epithelial cells in another) alongside the global distribution, the model allocates capacity to represent both large-scale distinctions and nuanced local details, leading to improved resolution in the learned latent space (Fig. 1c). Following a similar principle, the hcl mode uses Monte Carlo importance sampling to approximate the expected loss of hard-negative sampling without explicit neighborhood-based sampling (Methods).
When applied to a single dataset, contrastive learning effectively captures biological variation in the latent space (Fig. 1d). However, with uniform sampling across multiple datasets, both biological and dataset-specific variations are encoded, yielding a latent space that separates by dataset and cell type (Fig. 1e). To address this, we introduce a dataset-aware sampler that restricts each minibatch to cells from a single dataset, ensuring contrasts reflect only biological differences—as in the single-dataset setting (Fig. 1f). Dataset-specific biases are further diminished through random minibatch shuffling; if such signals are encoded in one batch, they are disrupted and overwritten by subsequent minibatches from other datasets. Consequently, only biologically meaningful signals, such as gene coexpression patterns, persist throughout training, producing a latent space that reflects biological variation with minimal batch effects (Fig. 1f). In cases where datasets have minimal or no shared cell states, a leaky dataset-aware sampler enables soft alignment without imposing artificial harmonization, supporting flexible integration that respects dataset-specific signals (Extended Data Fig. 1a). Notably, this approach does not perform any explicit modeling of batch effects; instead, it selectively captures and encodes biological programs shared across datasets. Unlike prior batch-correction strategies that struggle in contrastive settings because of competing objectives, CONCORD integrates batch correction directly into the contrastive learning process through its sampling design, producing latent representations inherently robust to batch effects.
Both the hard-negative and the dataset-aware samplers follow a unified principle: probabilistically structuring minibatches to balance global biological diversity with local and dataset-specific variation. We integrate both samplers into a joint sampling framework, where the likelihood of selecting a cell satisfies both sampling schemes (Extended Data Fig. 1a,b and Methods). This generalized sampling strategy fundamentally reconfigures contrastive learning, enabling high-resolution representation learning and robust dataset integration within a single contrastive objective, and forms the core of the CONCORD framework (Extended Data Fig. 1c). With this simple innovation, CONCORD outperforms state-of-the-art methods using only a minimalist encoder with a single hidden layer, demonstrating that sampling design alone can transform contrastive learning performance on single-cell data—even without deep or complex architectures. This simplicity reduces training data requirements, enhances robustness and increases interpretability of the learned latent space.
CONCORD learns denoised latent representations that preserve underlying structures
Recovering biologically meaningful insights from single-cell data requires preserving the underlying geometric and topological structure of the gene expression space. To evaluate whether CONCORD meets this criterion, we benchmarked its performance on a suite of simulated datasets. As existing simulators often fail to generate complex biological structures like branching or loops, we developed a custom workflow to create realistic structures with flexible control over noise and batch effects (Fig. 2a).

a, Schematic of the simulation pipeline, which first produces a noise-free gene expression matrix based on a user-defined data structure, then introduces noise following a specified noise model and finally applies batch effects. b, Schematic of the benchmarking pipeline. Latent representations from each method are compared with the noise-free ground truth to assess preservation of topological and geometric features. The scIB metrics34 and probing classifiers are used to evaluate biological label conservation and batch harmonization. c, Performance of CONCORD and competing methods on a three-cluster simulation with dimensions listed. UMAP embeddings, cosine distance matrices and persistent homology analysis (persistence diagram and Betti curves) are shown for each method. The H0 point at infinity was excluded from the persistence diagram and curve. d, Performance on a complex trajectory with three loops, highlighting the same diagnostic plots as in c. e,f, Summary of key geometric and topological performance metrics for the cluster simulation (e) and the complex trajectory simulation (f). g, kNN graph visualization of the latent spaces from a complex-tree simulation, with zoomed-in views of the highlighted branch.
To assess the quality of learned representations, we established a comprehensive evaluation pipeline. While standard benchmarks like the single-cell integration benchmarking (scIB) framework34 effectively measure label preservation and batch mixing, they are often insufficient for evaluating the preservation of complex biological structures35,36. We, therefore, supplemented them with probing classifiers37,38—a standard approach for evaluating representation learning—to assess the conservation of biological labels in the latent space. Additionally, to quantify structure fidelity, we incorporated geometric metrics such as trustworthiness and global distance correlation, as well as topological data analysis (TDA) based on persistent homology and Betti numbers (Fig. 2b). These metrics evaluate embedding at complementary scales: trustworthiness quantifies local neighborhood preservation, while persistent homology captures global topological features—such as clusters (Betti-0), loops (Betti-1) and voids (Betti-2). These features are visualized in persistence diagrams and Betti curves, where stable structures appear as long-lived features in the persistence diagram and extended plateaus in the Betti curve, whereas transient, noise-induced features vanish quickly.
We evaluated both CONCORD variants on a simple, single-batch simulation consisting of three well-separated clusters corrupted by cluster-specific Gaussian noise (Fig. 2c and Extended Data Fig. 2a). Compared to a broad set of dimensionality-reduction methods—including diffusion map39, NMF5, factor analysis6, FastICA40, latent Dirichlet allocation41, zero-inflated factor analysis (ZIFA)42, scVI10 and potential of heat diffusion for affinity-based trajectory embedding (PHATE)43—CONCORD cleanly separated clusters, as reflected in both the latent space and pairwise distance matrices. In contrast, many methods failed to fully resolve the clusters or introduced spurious structures, such as trajectory-like artifacts (Fig. 2c). Persistent homology confirmed these observations; CONCORD’s Betti-0 plateau accurately reflected the expected three-cluster topology and closely matched the noise-free reference, highlighting its strength in both denoising and structure preservation.
On a more complex simulation with three loops and multiple branching points (Fig. 2d and Extended Data Fig. 2b), CONCORD faithfully recovered the complete topology. By contrast, other methods either distorted the structure or failed to detect the correct number of loops in Betti analysis, likely because of excessive noise retention. Although PHATE produced a visually similar embedding, its Betti curve identified only a single persistent loop, indicating that critical topological features were obscured in its latent space.
Quantitative evaluation of geometric and topological metrics confirmed that CONCORD consistently outperformed competing methods (Fig. 2e,f). Notably, CONCORD maintained high trustworthiness across a wide range of neighborhood sizes, underscoring its ability to preserve local geometry at multiple scales (Extended Data Fig. 2c,d). In contrast, other methods exhibit considerable declines in trustworthiness, indicating a loss of fine-scale geometric relationships.
To assess the impact of hard-negative sampling, we simulated a hierarchical branching tree (Fig. 2g and Extended Data Fig. 2e–g). Without hard-negative sampling, subbranches were unresolved. Moderate enrichment of hard negatives substantially improved resolution for both CONCORD variants, with the kNN mode being more susceptible to excessive local focus, which obscured global distinctions (Extended Data Fig. 2f,g).
CONCORD learns a coherent, batch-effect-mitigated latent representation
Batch effects often appear as dataset-specific global signals that can obscure biological variation. In CONCORD, these signals rapidly diminish during training when minibatches are restricted to single datasets (Fig. 1f). Unlike conventional batch-correction methods that rely on explicit alignment models, CONCORD makes minimal assumptions about the source or form of batch effects and instead prioritizes learning coherent, biologically meaningful gene covariation patterns. This leads to more accurate preservation of biological structure while mitigating technical artifacts.
We first evaluated CONCORD on a simulated five-cluster dataset with varying noise, batch effects and batch size imbalance (Fig. 3a and Extended Data Fig. 3a). Across these conditions, CONCORD was the only method to robustly recover all five clusters. This success is attributable to its dataset-aware sampler, as using a conventional uniform sampler (that is, the naive contrastive approach) resulted in pronounced batch effects. In more challenging scenarios with more batches and greater imbalance, CONCORD and Harmony were the only methods that consistently separated the underlying clusters (Extended Data Fig. 3b).

a, Two-batch, five-cluster simulation with imbalanced batch sizes. Heat maps show the noise-free ground truth and the input data with noise and batch effects. Latent spaces from each method are visualized by UMAPs, colored by batch. Full cluster simulation results are in Extended Data Fig. 3a,b. ‘Contrastive’ refers to naïve contrastive learning that uses the same encoder architecture and objective as CONCORD but with uniform sampling. b, Trajectory simulation with varying degrees of state overlap between batches. The input structure is shown by a heat map and PCA. For each method, the latent space is visualized by a kNN graph (k = 15) colored by simulated time to assess cross-batch integration along the trajectory. c, Loop simulation with varying degrees of state overlap between batches. kNN graphs are shown for the ground truth (edges omitted) and for CONCORD and selected methods. Full results are in Extended Data Fig. 3c. d, Tree simulation with varying degrees of state overlap between batches. kNN graphs are shown for the ground truth, CONCORD and selected methods. Full results are in Extended Data Fig. 3d. e, Trajectory simulation with 16 batches, each with a different batch effect, as shown by the heat map. kNN graphs (k = 15) colored by batch are shown for each method’s latent embedding. For scVI and both CONCORD modes (hcl and kNN), kNN graphs colored by simulated time are also shown. A table displaying detailed benchmarking metrics is provided (metric definitions in Methods). f, Trustworthiness across neighborhood sizes for the multibatch simulation in e. g, Prediction with limited training data for scVI and CONCORD. A specified number of batches were held out during training. We ran 5 replicates with random batch withholding and quantified batch mixing using the kNN-based batch classification error (k = 30). Means and 95% confidence intervals are plotted. h, Ranking of integration methods across simulated data, showing ranks for batch correction, biological label conservation, topological and geometric metrics, and overall score. For cluster simulations, Betti curves became noisy when the number of clusters exceeded three and we did not find a robust way to infer Betti numbers; therefore, topology scores were excluded for these datasets.
Single-cell studies often involve continuous state transitions sampled across different conditions, where cell states may only partially overlap. Methods that make explicit assumptions about the data structure—such as requiring matched clusters—often fail in these scenarios and produce distorted embeddings. We systematically tested this by simulating batch effects on trajectories, loops and trees with varying degrees of state overlap (Fig. 3b–d and Extended Data Fig. 3c,d). Many competing methods exhibited poor alignment and introduced artificial structures. In contrast, both CONCORD variants consistently recovered the correct topology with reduced noise, even when the overlap between batches was minimal.
We further tested performance on a trajectory with 16 distinct batch effects (Fig. 3e). While scVI and CONCORD both aligned the batches, scVI showed incomplete alignment at fine resolution. In contrast, CONCORD—particularly the kNN variant—achieved superior alignment and noise reduction. Quantitative metrics confirmed these observations; CONCORD preserved local geometry, evidenced by high trustworthiness (Fig. 3e,f), while exhibiting lower global distance correlation—a common trade-off in manifold learning44,45. Robustness was further demonstrated in a stress test where models were trained on a few randomly selected batches and used to predict the remaining ones (Fig. 3g). CONCORD maintained strong alignment, whereas scVI’s performance degraded markedly as the number of training batches decreased. This suggests CONCORD’s robustness stems from learning gene coexpression programs rather than explicitly modeling and correcting batch effects.
Across all simulations, CONCORD achieved high biological label conservation (Fig. 3h and Supplementary Table 1), with slightly lower batch-correction scores because it does not explicitly merge batches. By contrast, although scVI achieved high batch-mixing scores, it often produced overmixed embeddings that obscured underlying structure (Extended Data Fig. 3). The aggregate geometric score for CONCORD was reduced by its lower global distance correlation despite consistently strong trustworthiness; however, for data with manifold structures—such as single-cell data—global distances are often not reflective of true distance relationships between cell states43. Therefore, preserving local neighborhood fidelity is typically prioritized in single-cell analysis43,46. Nevertheless, CONCORD consistently ranks among the top methods for topological preservation, biological label conservation and overall performance. These results demonstrate that CONCORD provides a reliable and generalizable framework for dimensionality reduction and batch correction, even when the data structure is unknown or batch overlap is limited.
CONCORD aligns whole-organism developmental atlases and resolves high-resolution lineage trajectories
To assess whether CONCORD captures biologically meaningful structures, we benchmarked it against popular integration methods on Caenorhabditis elegans embryogenesis—a well-characterized system with a nearly invariant lineage tree47 that is also conserved in the related species Caenorhabditis briggsae48. Packer et al. initially generated a lineage-resolved atlas of C. elegans49, which was recently expanded by Large et al. to include over 200,000 C. elegans cells and 190,000 C. briggsae cells48. With expert-curated annotations generated through iterative, labor-intensive zoom-in analyses and validated by fluorescence imaging, these datasets provide an ideal benchmark for evaluating whether integration methods can accurately reconstruct and align developmental trajectories across species.
We first tested CONCORD on the original C. elegans atlas49 (>90,000 cells) (Extended Data Fig. 4a). The resulting embedding revealed disconnected trajectories among early-stage cells, which we hypothesized reflected missing states. These gaps persisted even after including C. elegans cells from the expanded Large et al. dataset. We, therefore, collected a new C. elegans dataset enriched for early embryos; adding this dataset resolved the gaps and yielded a continuous trajectory from zygote to terminal fates (Extended Data Fig. 4a). Using the extensive cell type and lineage annotations, we benchmarked CONCORD against other methods for batch correction and label conservation and assessed its sensitivity to key hyperparameters (Extended Data Fig. 4b–e). CONCORD greatly outperformed existing methods, with stable performance across the recommended hyperparameter range. Notably, the effect of hard-negative sampling mirrored trends observed in simulations; moderate local enrichment improved resolution, whereas excessive local sampling disrupted global structure (Extended Data Fig. 4f).
When applied to over 410,000 cells from the combined cross-species dataset and our new early-embryo collection, CONCORD generated a unified developmental atlas that closely matched the expert annotations, achieving cross-species alignment and resolving lineages at ultrahigh resolution (Fig. 4a,b). Both the hcl and kNN modes yielded similar, high-quality embeddings (Fig. 4a and Extended Data Fig. 5a). Because scIB34 could not scale to this dataset, we quantified integration performance using probing classifiers to assess batch mixing, cell type and lineage label preservation (Fig. 4c). CONCORD excelled on these metrics, whereas other methods either failed to fully align the species or lost resolution, consistent with visual inspection of the uniform manifold approximation and projection (UMAP) embeddings. As the complexity of the learned structure exceeded the capacity of two-dimensional (2D) UMAP, we encourage readers to explore the interactive three-dimensional (3D) visualizations (https://qinzhu.github.io/Concord_documentation/galleries/cbce_show/#__tabbed_1_1).

a, UMAPs from CONCORD and other integration methods, colored by inferred embryo time and species. Zoomed-in UMAPs for scVI and CONCORD (hcl) show approximately matched regions, colored by lineage and species. b, Global 2D and 3D CONCORD (hcl) embeddings colored by cell type and inferred embryo time. c, Overlap between expert-curated cell type and lineage annotations. A histogram shows lineage annotations concentrated in early-stage cells and cell type annotations predominantly in late-stage cells. Integration performance was evaluated separately for early-stage cells (lineage labels) and late-stage cells (cell type labels) using probing classifiers. d, Global 3D UMAPs of CONCORD, scVI and Harmony, highlighting cells mapped to the lineage subtree that give rise to ASE, ASJ and AUA neurons. For each method, the most representative view was selected. e, Heat map showing the top 50 most variable latent dimensions in the ASE, ASJ and AUA neuron subset for scVI, Harmony and CONCORD (hcl). Expression of gcy-5 and gcy-14 is overlaid on a zoomed UMAP recomputed from the CONCORD latent space. f, Lineage purity and average lineage distance computed across 2,000 randomly selected kNN neighborhoods for each method. For each randomly sampled anchor cell, we retrieve its k-nearest neighbors in the embedding and compare their lineage relationships to the lineage graph. Purity is the fraction of neighbors assigned to the same lineage as the anchor; average lineage distance is the mean hop distance on the lineage tree from the anchor to its neighbors. Box plots show the median (center line), quartiles (box limits), 1.5× the interquartile range (whiskers) and outliers (points). g, Zoomed-in UMAPs for mesoderm (excluding pharynx), highlighting major input lineages and cell types. Each lineage is represented by its cluster medoid; edges connect parental lineages to daughters following the lineage tree. h, Zoomed-in UMAPs for pharynx, annotated by cell type and broad input lineages. Selected lineage paths to pm1/2, pm3–pm5 and pm7 are highlighted. i, scVI and CONCORD were trained on the combined C. elegans data from Packer et al.49 and our newly collected batch and then used to project the full atlas including C. elegans and C. briggsae data from Large et al.48. Resulting UMAPs are colored by species and integration performance was evaluated with probing classifiers. Acc., accuracy; annot., annotation; avg., average.
Projecting the lineage tree onto CONCORD’s embedding revealed strong concordance with established lineage and fate relationships (Extended Data Fig. 5b). For example, the ASE, ASJ and AUA neurons—derived from AB progenitors—formed branching trajectories that mirrored their true lineage structure (Fig. 4d). In contrast, other methods introduced discontinuities, failed to resolve key bifurcations or generated artificial structures. Strikingly, CONCORD’s latent space resolved ASE-left and ASE-right neurons, characterized by differential expression of GCY receptors (Fig. 4e). Although morphologically symmetric, these neurons exhibit functional asymmetry in salt-sensing responses50,51.
To systematically assess preservation of lineage structure in the latent space, we evaluated lineage purity and average lineage distance within randomly selected kNN neighborhoods, with k ranging from 30 to 300 (Fig. 4f). We reasoned that if a latent representation reflects lineage structure, each cell’s neighbors should belong predominantly to the same lineage or an immediate relative—captured by high purity and low average lineage distance. CONCORD maintained high lineage purity even at large values of k. Furthermore, neighboring cells from different lineages were often close relatives, as reflected by a low average lineage distance. In contrast, other methods produced embeddings with substantially more mixed-lineage neighborhoods. Collectively, these findings indicate that the CONCORD latent space preserves genuine lineage structures, enabling refinement of existing annotations (Extended Data Fig. 5c) and highlighting its broader utility for inferring bona fide differentiation trajectories in developmental studies52,53.
In addition to fate bifurcation in neuronal development, fate convergence from different lineages is a common pattern in C. elegans organogenesis. In the context of muscle formation, CONCORD accurately resolved how the MS, C and D lineages converge into well-resolved subbranches of body wall muscle, as well as rare convergence events such as the integration of ABplp/ABprp-derived and MS-derived cells into intestinal muscle (mu_int) (Fig. 4g). Pharyngeal development—featuring complex branching and convergence of AB-derived and MS-derived cells—was likewise resolved in detail by CONCORD (for example, pm3–pm5 deriving from both AB and MS lineages, and pm1–pm2 and pm6–pm8 specific to AB/MS lineages), whereas other methods recovered fewer fine-grained details (Fig. 4h). Crucially, all analyses were performed directly in CONCORD’s global latent space, without subset-specific highly variable gene (HVG) selection or realignment—steps that are often necessary for other methods.
Lastly, to test model generalizability, we trained CONCORD and scVI on a subset of C. elegans batches and projected them onto unseen C. elegans and all C. briggsae data (Fig. 4i). CONCORD successfully integrated the held-out batches, aligned the two species and resolved the majority of cell types. In contrast, scVI produced a markedly lower-quality projection, with poor cross-species alignment and diminished cell type resolution.
CONCORD captures cell cycle and differentiation trajectories in mammalian intestinal development
Unlike C. elegans, where early divisions are largely driven by maternal transcripts54, mammalian development involves extensive proliferation coupled with ongoing differentiation. To assess whether CONCORD can resolve these intertwined processes, we applied it to a single-cell atlas of embryonic mouse intestinal development55, which spans multiple developmental stages, batches, spatial segments and enriched cell populations—posing a challenging integration task because of incomplete batch coverage.
CONCORD effectively integrated the data and resolved fine-grained substructures across diverse cell types (Fig. 5a and Extended Data Fig. 6a). Both hcl and kNN modes revealed loop-like patterns within many cell types—as evidenced by persistent homology—and often missed by other methods (Fig. 5b–d and Extended Data Fig. 6b). The majority of these loops correspond to cell-cycle progression, supported by progressive expression of cell-cycle gene programs along the loops (Extended Data Fig. 6b). For example, in intestinal epithelial cells, CONCORD not only resolved rare subtypes such as enteroendocrine cells but also revealed two parallel trajectories—each encompassing both a cell-cycle loop and a differentiation path—corresponding to stem cell proliferation and differentiation in spatially distinct regions (Fig. 5b). These structures were not captured by other methods and were supported by adult zonation markers such as Bex4 and Onecut2 (ref. 56), suggesting that CONCORD can detect epithelial zonation as early as embryonic day 13.5.

a, The 2D and 3D UMAP visualizations of CONCORD (kNN mode) latent space, colored by cell type and cell-cycle phase, with UMAPs from scVI and Seurat (colored by cell type) for comparison. b, Zoomed-in views of epithelial cells in the 3D global UMAP, colored by cell subtype, zonation and expression of zonation-specific markers (Bex4 and Onecut2). A red marker and arrow indicate the viewing angle within the 3D global UMAP. Persistence diagrams are shown for scVI and CONCORD. c, Zoomed-in view of ENS cells, colored by cell-cycle phase and cell state or branch annotations, based on Morarach et al.57, along with state-specific marker expression. A red marker and arrow indicate the viewing angle. Persistence diagrams are shown for CONCORD and scVI. d, Zoomed-in view of Pdgfra− mesenchymal cells and smooth muscle cells, colored by cell-cycle phase, subtype annotation and selected subtype-specific markers. A red marker and arrow indicate the viewing angle. e, Heat map of latent representations generated by CONCORD (kNN), Seurat and scVI. f, Interpretation of the CONCORD latent space using gradient-based attribution techniques. Activation of Z46 in epithelial and ENS cells is attributed to the coexpression of epithelial-specific and neuron-specific gene sets in their respective contexts. Gene Ontology (GO) enrichment analysis of these gene sets is shown. FDR, false discovery rate.
In the enteric nervous system (ENS), CONCORD captured the cell cycle of Sox10⁺ progenitor cells and identified two distinct branches of neuronal development marked by Etv1 and Bnc2, matching previous observations57 (Fig. 5c). These branches appear to converge through shared expression of neuronal maturation genes broadly active at late stages of both branches (Extended Data Fig. 6c).
In mesenchymal cells—which comprise a major fraction of this dataset—CONCORD uncovered extensive heterogeneity within the Pdgfra− and smooth muscle populations (Fig. 5d). These included four consecutive cell-cycle loops marked by the expression of Ebf1, Slit2, Kit and Acta2, with gradual transitions between the loops. Notably, Ebf1 and Slit2 have been linked to mesenchymal multipotency58,59, while Kit marks interstitial cells of Cajal and their progenitors60. Unlike traditional approaches where cell cycle often confounds cell type annotation, CONCORD preserves both proliferation and differentiation structure, enabling the identification of previously uncharacterized subpopulations. The complexity of these structures necessitates 3D visualization and we encourage readers to explore the interactive embeddings (https://qinzhu.github.io/Concord_documentation/galleries/huycke_show/).
Unlike Seurat and scVI, which left many latent dimensions underused, CONCORD produced a dense and interpretable latent space that reflects rich biological structure and makes full use of its representational capacity (Fig. 5e). Each latent dimension typically encapsulates multiple gene coexpression programs, which can be interpreted at either single-cell or cell-state resolution using gradient-based attribution methods61 in a context-dependent manner (Fig. 5f). For instance, latent neuron 46 (Z46) is activated in both epithelial cells and ENS cells but attribution analysis revealed that it is driven by two distinct sets of highly coexpressed genes depending on the cellular context (Fig. 5f and Extended Data Fig. 6c). In epithelial cells, Z46 activation is linked to goblet-cell-specific genes enriched in glycosylation pathways, whereas, in ENS cells, it reflects neuronal maturation genes expressed in late-stage neurons. Notably, neither gene set shows strong expression outside its respective context, demonstrating that the CONCORD latent space captures biologically meaningful, context-specific gene coexpression programs.
CONCORD generalizes across modalities and scales
CONCORD’s domain-agnostic design allows it to be applied to diverse data modalities beyond scRNA-seq. We tested this on a challenging single-cell ATAC-seq benchmark dataset comprising peripheral blood mononuclear cells (PBMCs) from two donors profiled across eight different technologies62 (Fig. 6a). On both quantitative metrics and visual inspection of the embeddings, CONCORD yielded much better batch correction and biological label conservation than other methods, including the original study’s Harmony-based analysis (Fig. 6b,c and Extended Data Fig. 7a,b).

a, Schematic of the PBMC scATAC-seq benchmarking experiment spanning multiple technologies and experimental batches62. b, Summary scores for all integration methods on the PBMC scATAC-seq data; detailed metric values are provided in Extended Data Fig. 7b. c, The t-distributed stochastic neighbor embeddings from the original publication (Harmony integration) and embeddings produced by scVI and CONCORD, colored by batch and original cell type annotations. To refine annotations, we analyzed paired scRNA-seq datasets with CONCORD and projected the refined labels onto the scATAC-seq embedding through shared scMultiome cells. d, Schematic of the experimental design for the breast cancer tumor microenvironment sample, where a single formalin-fixed paraffin-embedded tissue block was analyzed with multiple technologies63. UMAP embeddings derived from the CONCORD and scVI latent spaces are colored by batch and original cell type annotations. Full results for all integration methods are shown in Extended Data Fig. 7c. e, Hematoxylin and eosin image and overlay of cell type annotations based on Xenium data, reproduced under the Creative Commons Attribution 4.0 International License from the original publication63 without modification. The experiment was performed in replicate on two serial sections and one representative section is shown here. f, Ranking of integration method performance across all real-world benchmarking datasets, excluding datasets where scIB metrics could not be robustly computed. Each method was scored on both batch correction and biological label conservation metrics, and the overall rank was computed on the basis of the average score. Missing values indicate methods that failed to run because of excessive resource demands or violated model assumptions. g, Runtime of integration methods across all real-world benchmarking datasets. *Harmony was run using a reduced-dimensional PCA projection, whereas all other methods were applied to gene expression matrices with 5,000–10,000 variable features.
The CONCORD embedding revealed fine-grained immune subtypes not present in the original annotations. To validate these, we refined the cell type labels using paired scRNA-seq and scMultiome data and projected them back onto the scATAC-seq embedding through shared scMultiome cells (Fig. 6c). Strikingly, refined clusters in scRNA-seq (for example, naive and memory B cells) corresponded precisely to clusters uncovered by CONCORD in scATAC-seq. This validation also uncovered a misannotation in the original study, where CD8⁺ naive T cells were incorrectly labeled as CD4⁺ T cells. Therefore, CONCORD greatly improved analysis on existing scATAC datasets. Notably, CONCORD achieved this high-resolution result using only simple log normalization, forgoing the complex, modality-specific data transformations often required for scATAC-seq analysis.
When applied to a breast cancer tumor microenvironment sample profiled with Xenium, 3′ and 5′ scRNA-seq and fixed RNA profiling technologies63—sharing only 307 genes—CONCORD in hcl mode achieved markedly better integration and cell type resolution than other approaches (Fig. 6d and Extended Data Fig. 7c). A key finding of the original study was that two DCIS (ductal carcinoma in situ) subtypes exhibit distinct adjacent microenvironments; DCIS-1 is bordered by both KRT15⁺ and ACTA2⁺ myoepithelial cells, whereas DCIS-2 is encircled exclusively by ACTA2⁺ myoepithelial cells (Fig. 6e). Notably, without access to spatial coordinates, CONCORD recapitulated these adjacency patterns by revealing differential connectivity between DCIS and myoepithelial clusters—consistent with signal bleed or segmentation-related transcript carryover commonly observed in spatial single-cell assays64.
Lastly, we benchmarked CONCORD on six additional scRNA-seq datasets curated by the Open Problems in single-cell analysis initiative65, including Tabula Sapiens (>1 million cells)66. CONCORD consistently achieved top performance across these datasets (Fig. 6f and Supplementary Table 2) while running substantially faster and with modest RAM/VRAM requirements (Fig. 6g and Extended Data Fig. 7d). By contrast, several methods—including LIGER, Scanorama and Seurat—failed to run at atlas scale because of heavy resource demands or violations of method assumptions. CONCORD-derived 2D UMAP embeddings for these datasets are provided in Extended Data Fig. 8 and additional examples, tutorials and resources are available on the CONCORD documentation website (https://qinzhu.github.io/Concord_documentation/).


