The autism spectrum isn’t a sliding scale; 39 traits show the complexity

Autism is a spectrum. This metaphor is a useful way to explain why autism seems so varied in different people. Since 2013, this term has been integrated into the name of the diagnosis itself, that of autism spectrum disorder (ASD). But what does this spectrum look like?
It is not simply a one-dimensional scale from “most autistic” to “least autistic,” which would reduce much of the diversity that the spectrum metaphor is intended to emphasize. There is no single trait that defines autism: it encompasses differences in social communication skills, interests, sensory sensitivities, and more. Each person’s profile is unique. These graphs, based on clinicians’ ratings of real people using the Autism Symptom Dimensions Questionnaire, reveal a more nuanced “spectrum” of differences.
And this picture doesn’t take into account how people’s profiles change over time in response to treatments, life circumstances, or age. It also does not measure individuals’ overall cognitive ability, something that researchers treat as a distinct but important characteristic that can affect a person’s particular constellation of traits.
On supporting science journalism
If you enjoy this article, please consider supporting our award-winning journalism by subscription. By purchasing a subscription, you are helping to ensure the future of impactful stories about the discoveries and ideas shaping our world today.
Not all of these characteristics constitute deficiencies that need to be addressed. “A person not making eye contact is useful information for diagnosing autism,” but it’s not necessarily an appropriate target for intervention, says Ari Ne’eman, co-founder of the Autistic Self Advocacy Network and a health policy researcher at Harvard University. It’s best to think of many of these traits as normal human variation rather than something to treat or modify, Ne’eman says.
A spectrum with multiple dimensions
Each of the 39 corners of the circle represents a question from the Autism Symptom Dimensions Questionnaire. The traits associated with each question (listed below) are grouped into key symptom factors – the main aspects of behavior that assessors look for when assessing an autistic person.
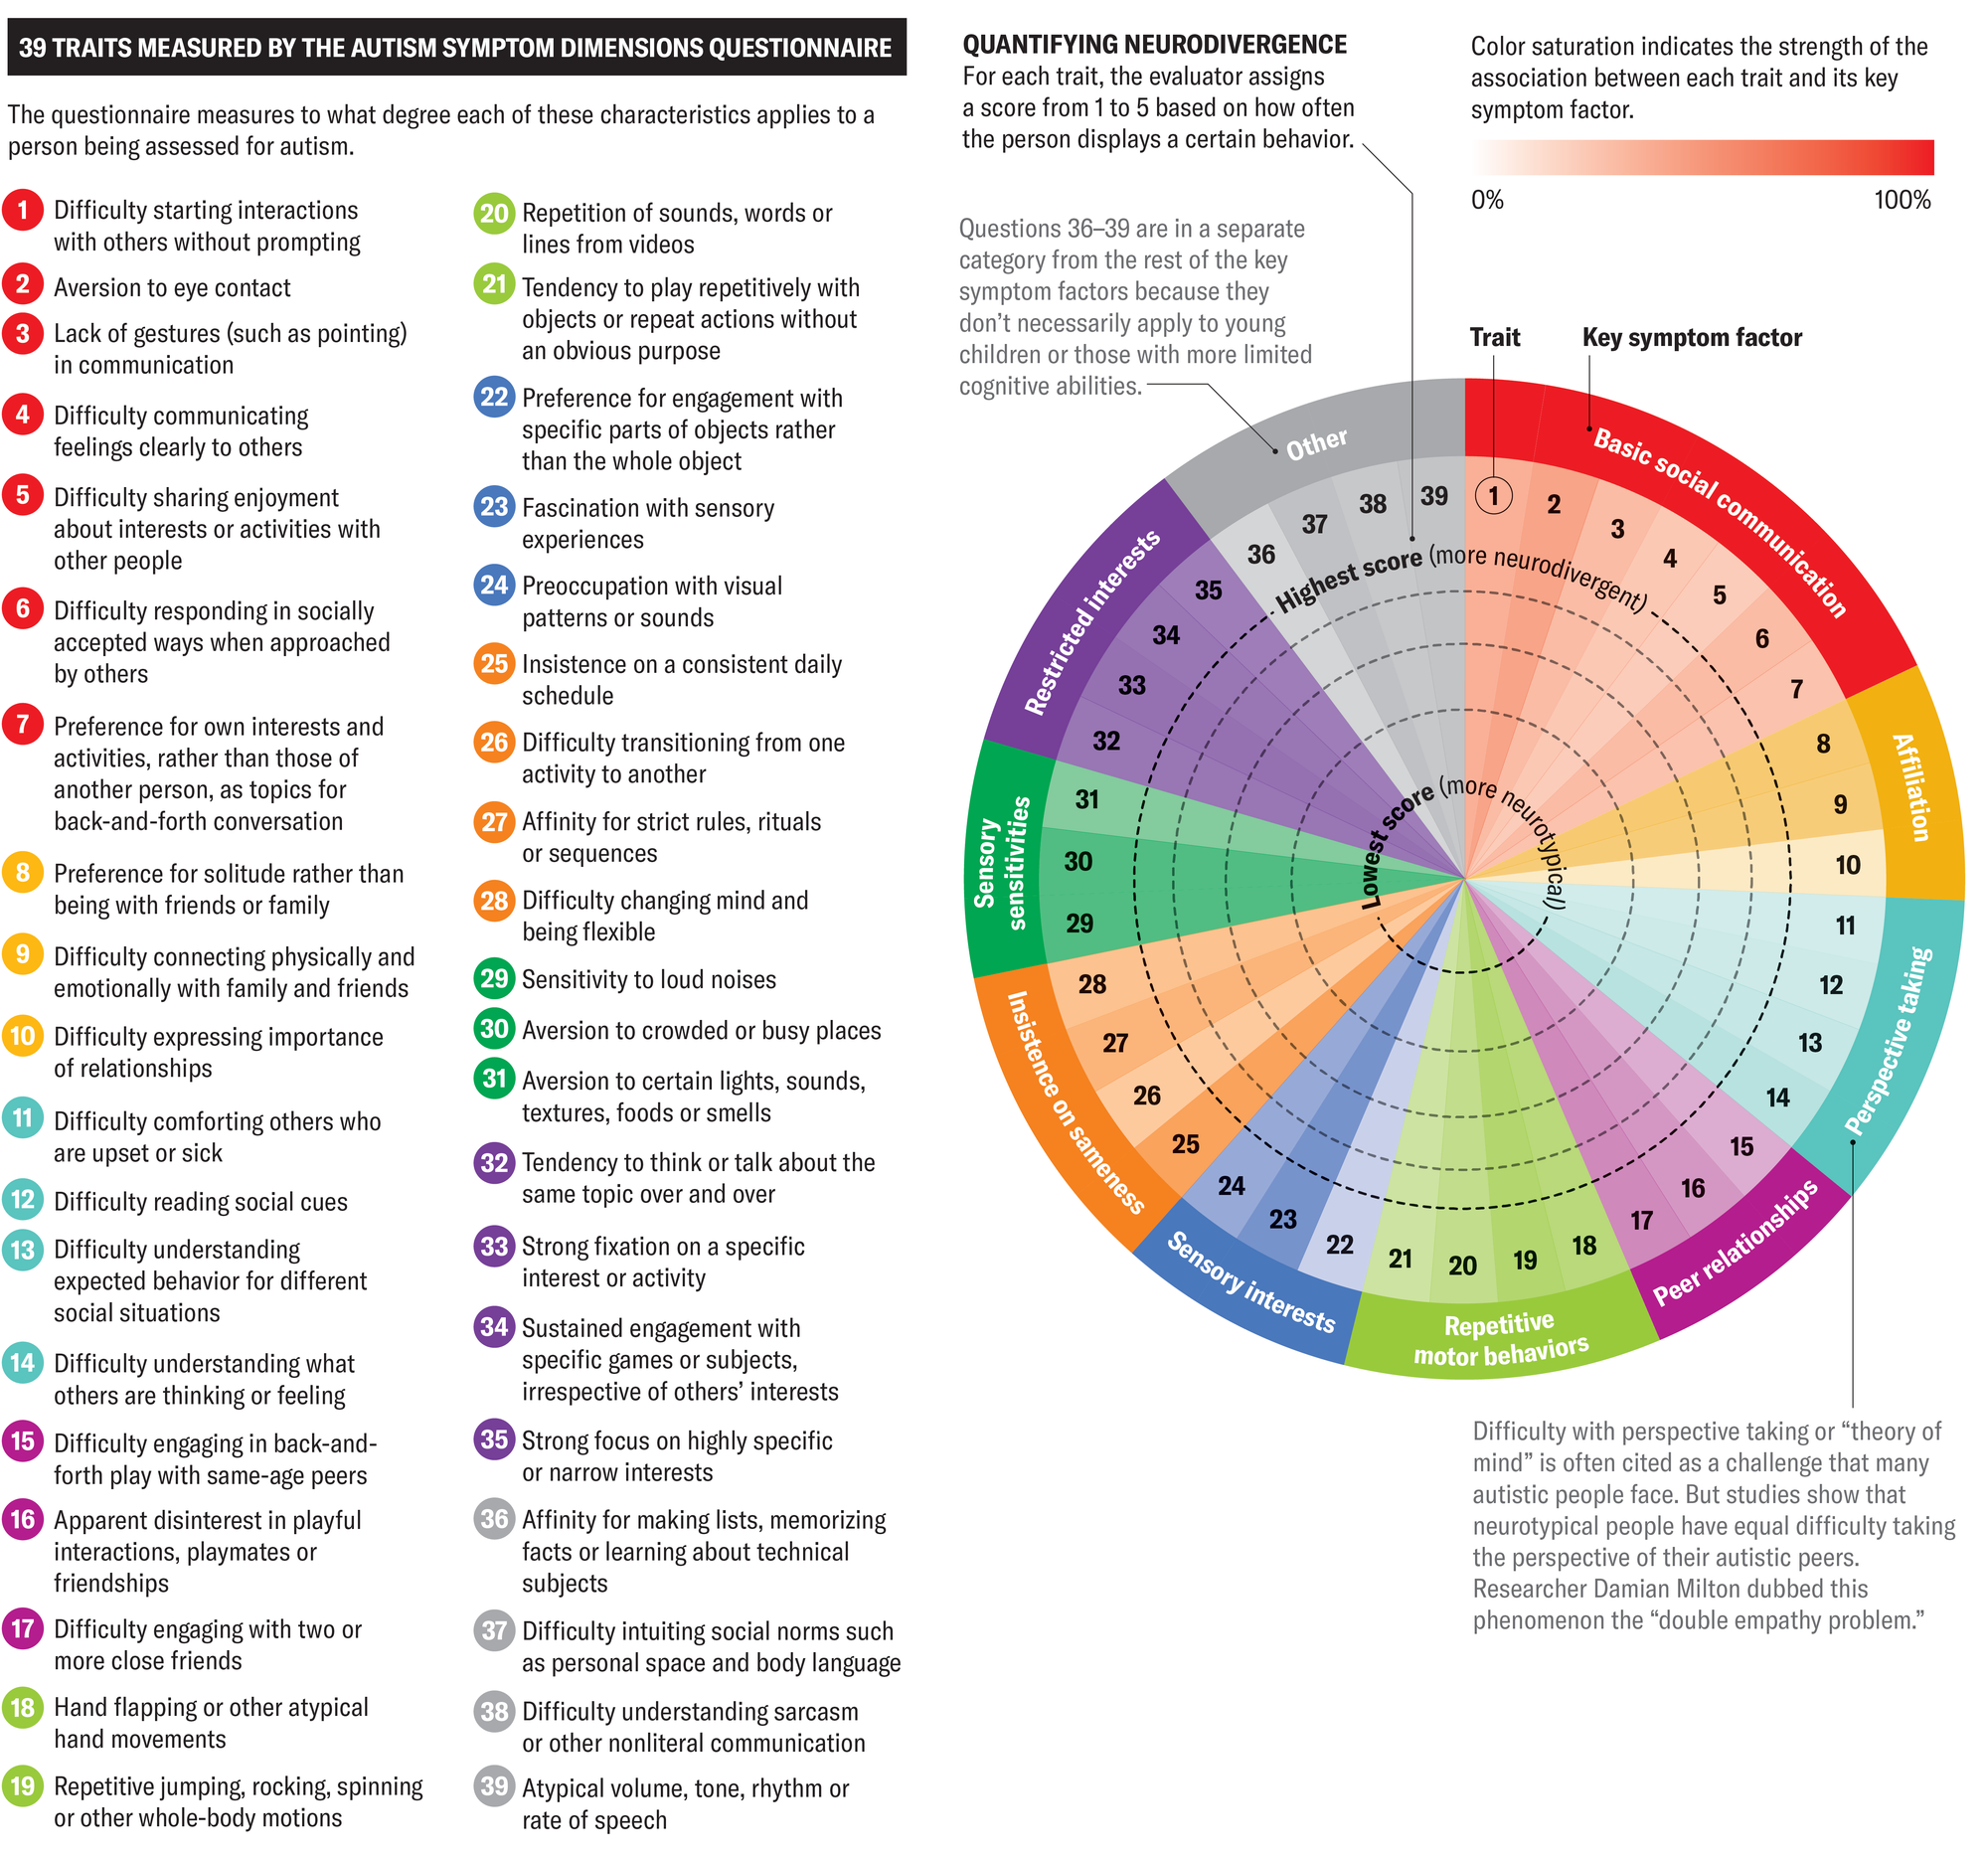
Amanda Montañez; Source: “Autism Symptom Dimensions Questionnaire: Development and Psychometric Evaluation of a New Open Source Measure of Autism Symptomology,” by Thomas W. Frazier et al., in Developmental medicine and child neurologyFlight. 65, no. 8; August 2023 (data)
Variation between individuals
These graphs represent the questionnaire responses of three different autistic people. This data reflects each person’s strengths and challenges at their current stage of development and may change over time.
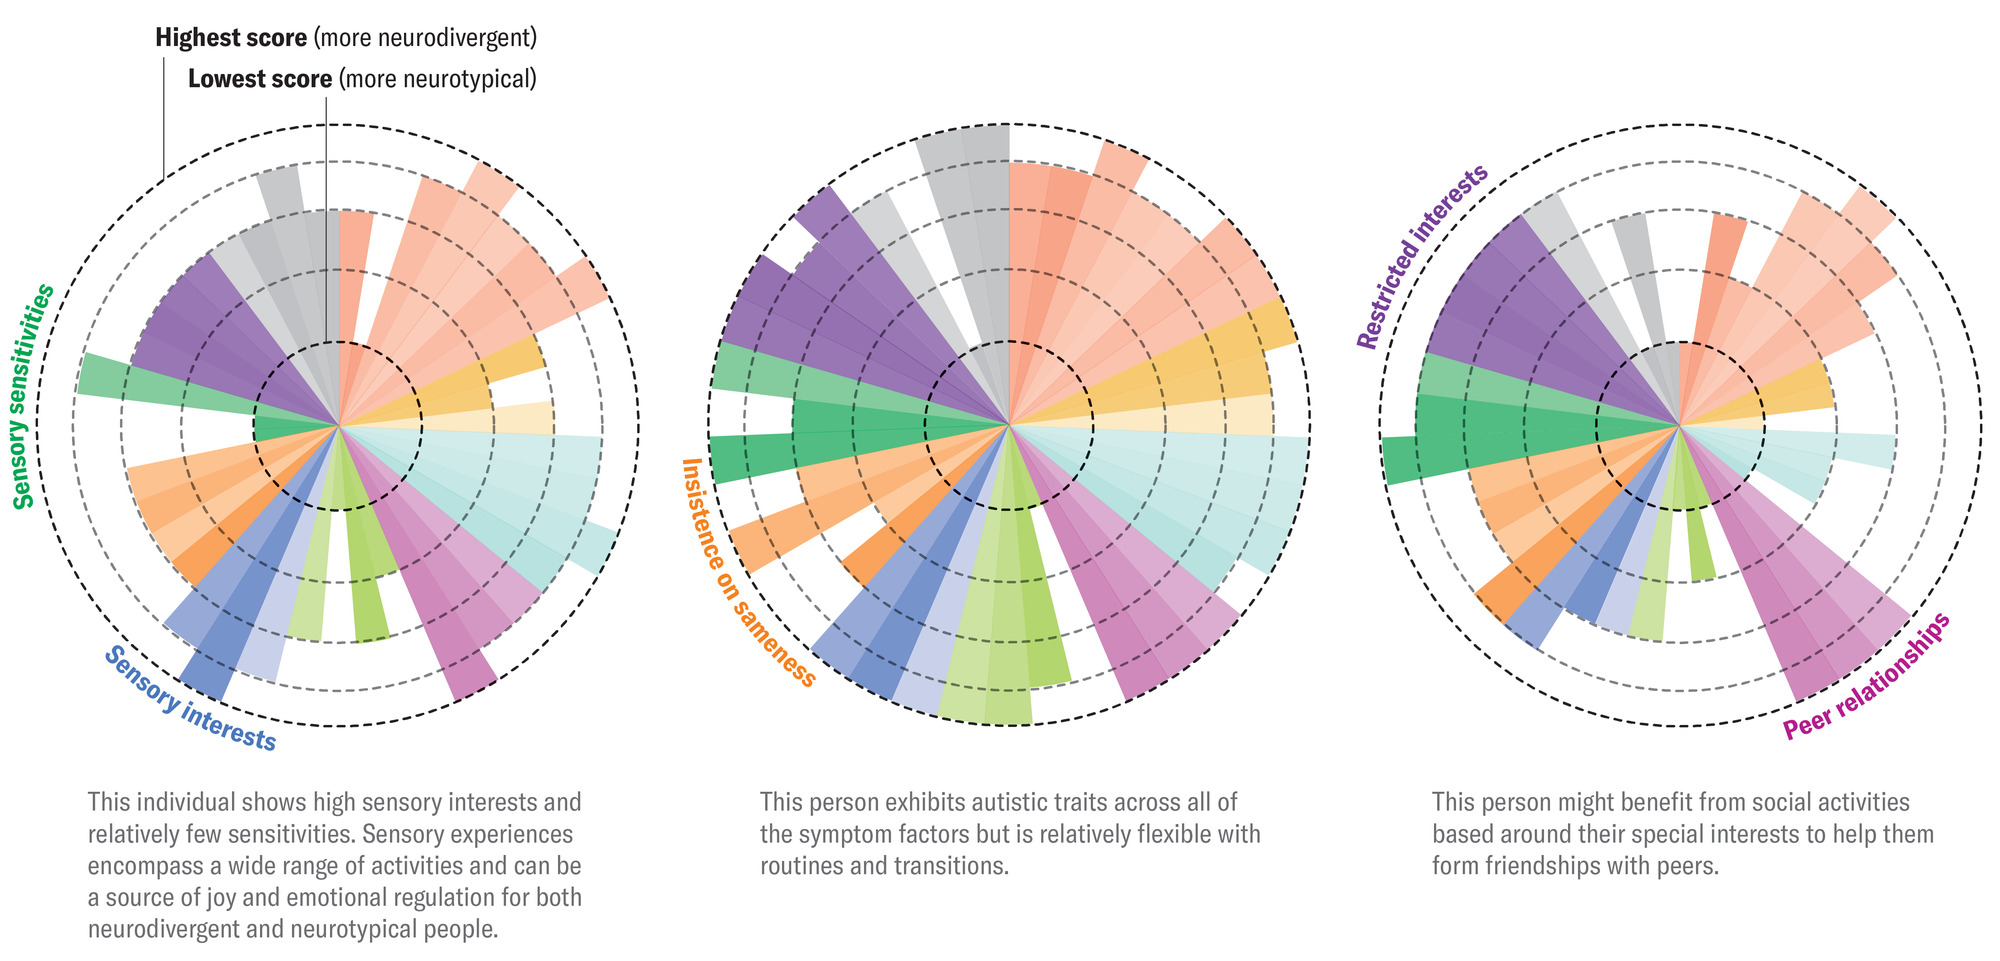
Amanda Montañez; Source: “Autism Symptom Dimensions Questionnaire: Development and Psychometric Evaluation of a New Open Source Measure of Autism Symptomology,” by Thomas W. Frazier et al., in Developmental medicine and child neurologyFlight. 65, no. 8; August 2023 (data)
It’s time to defend science
If you enjoyed this article, I would like to ask for your support. Scientific American has been defending science and industry for 180 years, and we are currently experiencing perhaps the most critical moment in these two centuries of history.
I was a Scientific American subscriber since the age of 12, and it helped shape the way I see the world. SciAm always educates and delights me, and inspires a sense of respect for our vast and beautiful universe. I hope this is the case for you too.
If you subscribe to Scientific Americanyou help ensure our coverage centers on meaningful research and discoveries; that we have the resources to account for decisions that threaten laboratories across the United States; and that we support budding and working scientists at a time when the value of science itself too often goes unrecognized.
In exchange, you receive essential information, captivating podcasts, brilliant infographics, newsletters not to be missed, unmissable videos, stimulating games and the best writings and reports from the scientific world. You can even offer a subscription to someone.
There has never been a more important time for us to stand up and show why science matters. I hope you will support us in this mission.


:max_bytes(150000):strip_icc()/Health-GettyImages-1003546132-3511dd688de248579fb090528edc2188.jpg?w=390&resize=390,220&ssl=1 "You Ate Undercooked Chicken—What Happens Now?")
