There’s 13 Great Lakes’ worth of water hidden beneath the contiguous US, new map reveals

It is not easy to determine the amount of water present in a landscape. A measly 1% Of Earth’s fresh water is found at the surface, where it can be seen and measured with relative ease. But underneath, the measurements vary wildly depending on the depth of the water table and the porosity of the soil that we can’t see directly.
Reed Maxwellhydrologist at Princeton University, likes to think of precipitation, snow and surface water as a running account used for short-term water management needs and groundwater like a savings account, where a larger sum should ideally accumulate over time.
But a new groundwater map by Maxwell and colleagues offers the highest resolution estimate to date of the amount of groundwater in the contiguous United States: approximately 306,500 cubic kilometers. This is 13 times the volume of all the Great Lakes in total, almost 7 times the quantity of water discharged by all the rivers on the planet in one year. This estimate, made at a resolution of 30 meters, includes all groundwater down to a depth of 392 meters, the deepest for which reliable porosity data exists. Previous estimates using similar constraints ranged from 159,000 to 570,000 cubic kilometers.
“It’s definitely an improvement on some of the previous ones [mapping] efforts,” said Grant Fergusonhydrogeologist at the University of Saskatchewan who was not involved in the research. “They’re looking for much better resolution than we’ve had in the past and using some interesting techniques.”
Well, well, well
Previous estimates of groundwater quantity were based largely on well observations.
“That’s what’s really crazy about groundwater in general,” said Laura Condonhydrologist at the University of Arizona and co-author of the paper. “We do pinpricks in the basement, where there is a well, they measure the depth of the water table, and that’s what we have to work with.”
But not all wells are measured regularly. For obvious reasons, there are generally more wells in places where there is more groundwater, making data on areas where there is less groundwater scarcer. And a well only represents a point, while depth of water table can vary considerably over short distances.
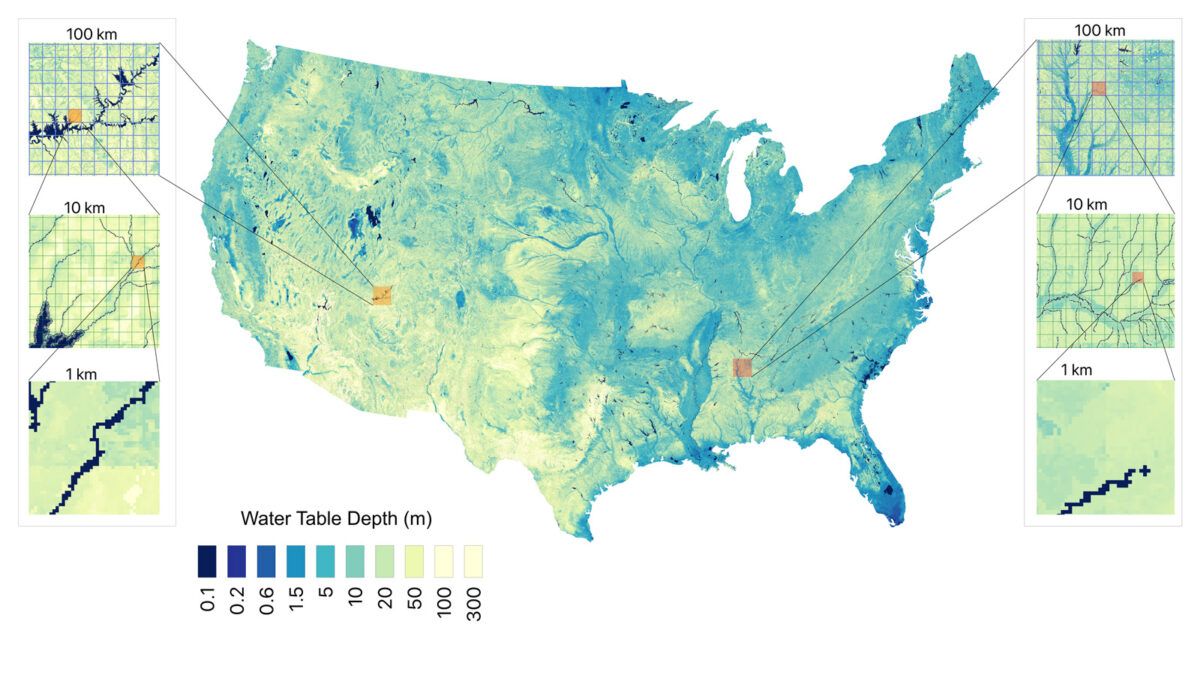
The researchers used these data points, along with their physical knowledge of how water flows underground, to model the depth of the water table at a resolution of about 1 kilometer. They also used satellite data to capture large-scale trends in water movement. But these data are of lower resolution: the data from NASA’s Tellus GRACE (Gravity Recovery and Climate Experiment) missionfor example, have a resolution of about 300 kilometers, or about 10,000 times coarser than the new map.
To demonstrate the value of high-resolution data, the team showed what happened when they reduced the resolution of their entire map from 30 meters to 100 kilometers – the spatial resolution of many global hydrological models. The resulting map, more pixelated, estimates just over 252,000 cubic kilometers of water, an 18% underestimate compared to the new map.
In addition to identifying groundwater quantities at high resolution, the new map reveals more nuanced information about known groundwater sources.
For example, it shows that about 40% of land in the border region of the United States has a water table depth less than 10 meters. “That 10-meter range is where you can have interactions between groundwater, plants and the soil surface,” Condon said. “And it really shows how connected these systems are.”
Bias in favor of good
The new work used direct well measurements as well as satellite data – around a million measurements taken between 1895 and 2023 – as well as maps of precipitation, temperature, hydraulic conductivity, soil texture, elevation and distance from streams. Then the scientists used the data to train a machine learning model.
In addition to its ability to quickly sort through large numbers of data points, Maxwell pointed out another advantage of the machine learning approach that may seem unexpected: its bias. Early estimates of groundwater were relatively simplistic, taking into account neither hydrogeology nor the fact that humans pump water from the ground themselves. The team’s machine learning approach was able to incorporate this information because evidence of groundwater pumping was present in the data used for training.
“When you hear about bias in machine learning all the time, it’s usually in a negative connotation, right?” Maxwell said. “Ultimately, when you can’t disentangle the signal of groundwater pumping and groundwater depletion from the nearly a million observations that we used to train this machine learning approach, it has implicitly learned this bias.… It has learned the pumping signals, it has learned the human depletion signal.”
Maxwell and the other researchers hope the map can be a resource for regional water management decision-makers, as well as farmers making irrigation decisions. Condon added that she hopes this will raise awareness about groundwater in general.
“Groundwater is literally everywhere, at all times,” she said. The map is “filled everywhere, wherever you are. In some places it’s 300 meters deep, in others it’s 1 meter deep. But wherever you are, dig, and there’s water somewhere.”
This article was originally published on Eos.org. Read the original article.


