How to use Apple Intelligence and what it can do on iPhone

Apple Intelligence is Apple’s generative artificial intelligence (AI) system, and it comes with a huge range of features and abilities. You’ll find it deeply embedded in your iPhone, whether that’s woven into your apps via Siri, Writing Tools, and more, or as standalone apps like Image Playground. Providing your iPhone meets the Apple Intelligence requirements, you’ve got plenty of choice over how to use it. You can also take advantage of the Apple Intelligence features on a compatible Mac or iPad.
Here, we’ll show you how to use the various Apple Intelligence-related features in iOS on your iPhone, but many of the features will work in a similar way on your iPad or Mac. We’ll run through the process for enabling Apple Intelligence on your iPhone for the first time, using Apple Intelligence to edit your photos, and how you can use it to keep focused. There’s so much you can do with Apple Intelligence – and there’s even more coming in iOS 26.
So put this guide to use and you’ll quickly be clued up on all of Apple’s latest AI tricks.
How to enable Apple Intelligence
First things first, you’ll want to set up Apple Intelligence on your iPhone, as it’s not enabled by default.
- Open the Settings app.
- Go to Apple Intelligence & Siri.
- Tap “Turn on Apple Intelligence,” or tap the button next to Apple Intelligence (what you see will depend on your version of iOS and whether you’ve previously set up Apple Intelligence).
- Your iPhone will start downloading the Apple Intelligence models, which could take a while as they’re several gigabytes in size.
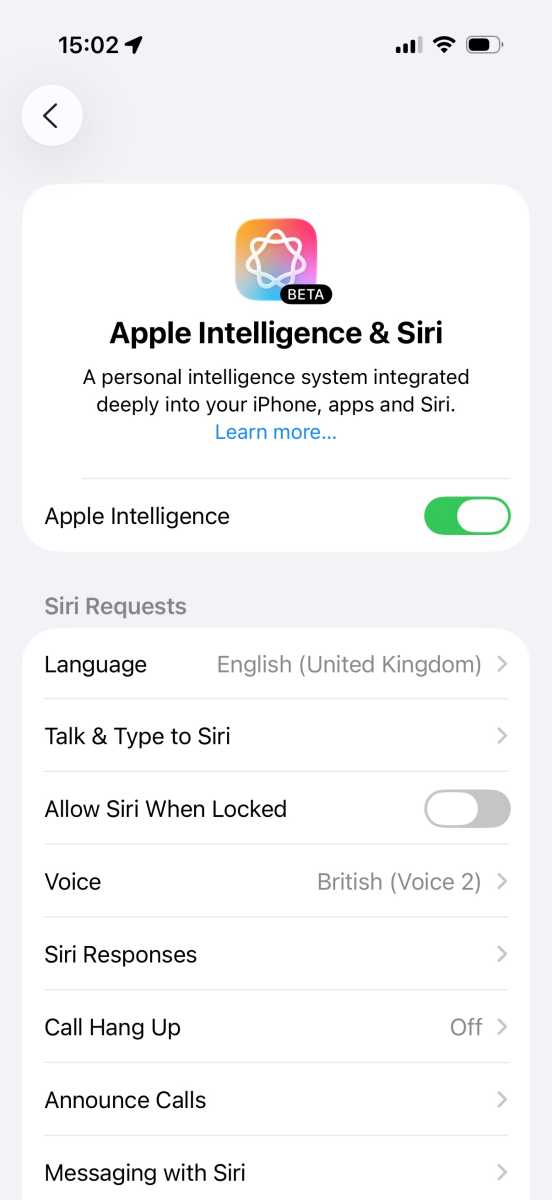
Setting up Apple Intelligence
.
Foundry
For more help see: How to get Apple Intelligence on an iPhone and How to get Apple Intelligence on Mac.
Apple Intelligence includes Writing Tools, and you’ll find them more or less anywhere text is used in iOS. These tools can rewrite text, summarize text for you, format it into a table, and a lot more.
Here’s how you can proofread text using Writing Tools:
- First, highlight the text you want read.
- Tap the > arrow.
- Choose Writing Tools.
- Select Proofread and Writing Tools will edit your text and correct any mistakes.
- Tap the up or down arrows to see an explanation for each change made.
- Tap Use Original to revert the changes.
- Tap Original to switch between the original and corrected text.
To rewrite text, do the following:
- Highlight the text, then tap the > arrow.
- Choose Writing Tools > Rewrite. This uses Apple Intelligence’s standard rewriting tone.
- To pick a different tone, tap Writing Tools, then choose either Friendly, Professional, or Concise.
- To rewrite the text in a different manner, tap the “Describe your change” box, then explain what you want (such as “make this more enthusiastic”).
Writing Tools can also summarize and organize your text. Here’s how you do that:
- Highlight the text, then tap the > arrow.
- Choose Writing Tools.
- You can choose Summarize, Key Points, List, or Table. Each will sum up the text in a different way.
- You can also choose Rewrite, or specify a Friendly, Professional, or Concise tone.
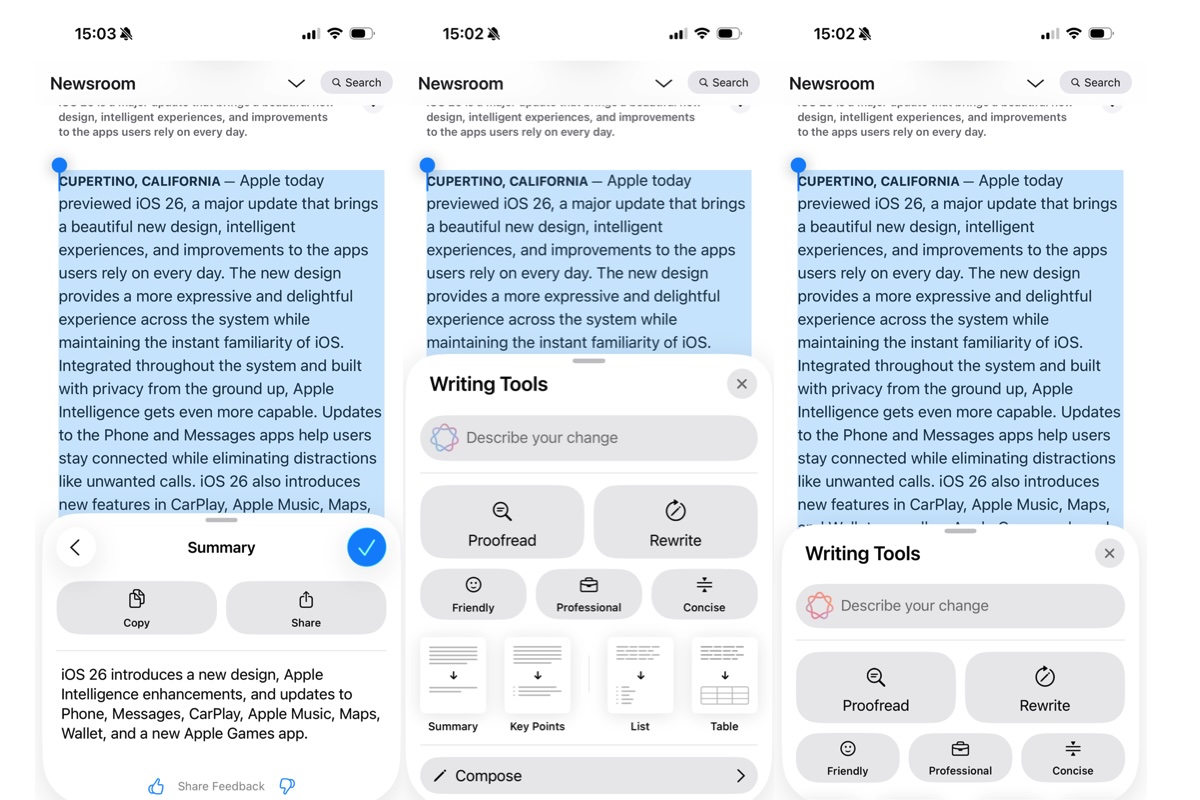
Using Writing Tools.
Foundry
ChatGPT brings extra power to Writing Tools thanks to its ability to compose text:
- Either highlight a piece of text or start with a blank document, then tap to bring up the context menu, select Writing Tools, swipe up, then choose Compose.
- Enter a description of what you want in the “Compose with ChatGPT” box.
- ChatGPT will then complete your request, either by generating something from scratch or by using your highlighted text as a starting point. For instance, you might ask it to turn your text into a bedtime story.
- ChatGPT might give you some additional suggestions. If it does, tap one, make any adjustments if needed, then tap the up arrow and ChatGPT will tweak its output.
- If ChatGPT asks you for more details, enter them and select Update, or tap Ignore to keep things as they are.
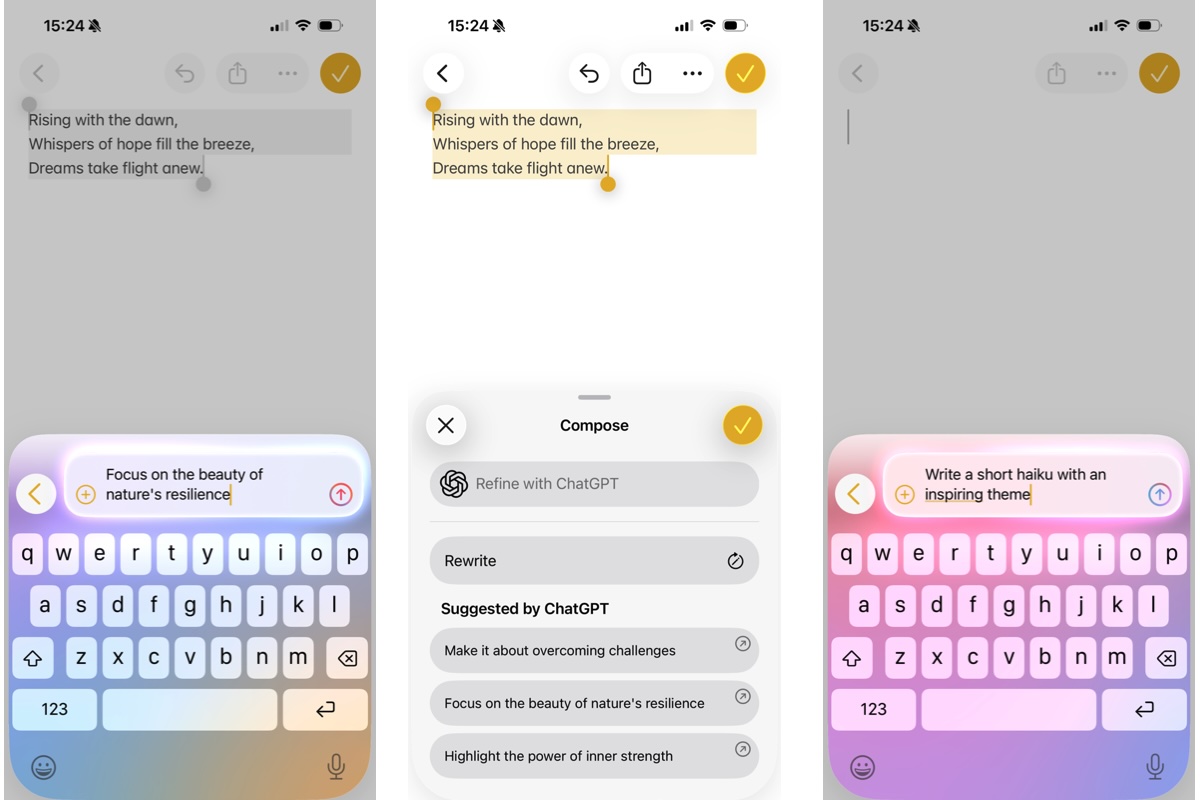
Using ChatGPT with Writing Tools
.
Foundry
How to create AI images in Image Playground
Apple’s Image Playground app is designed to generate cartoon-like images based on prompts. It can also use people you know or photos you’ve taken as the basis for its creations.
- Open the Image Playground app and tap New Image.
- Tap the “Describe an image” box and enter a description of what you want.
- Alternatively, tap some of the suggested elements. Select Show More to get more suggestions.
- Tap the avatar icon in the bottom-right to add a person, or the landscape icon to either add an existing photo or take a new one. Your generated image will be based on these added elements.
- You can change the image style, Animation, Illustration, or Sketch if you tap on the +.
- When you’re done, tap Save.
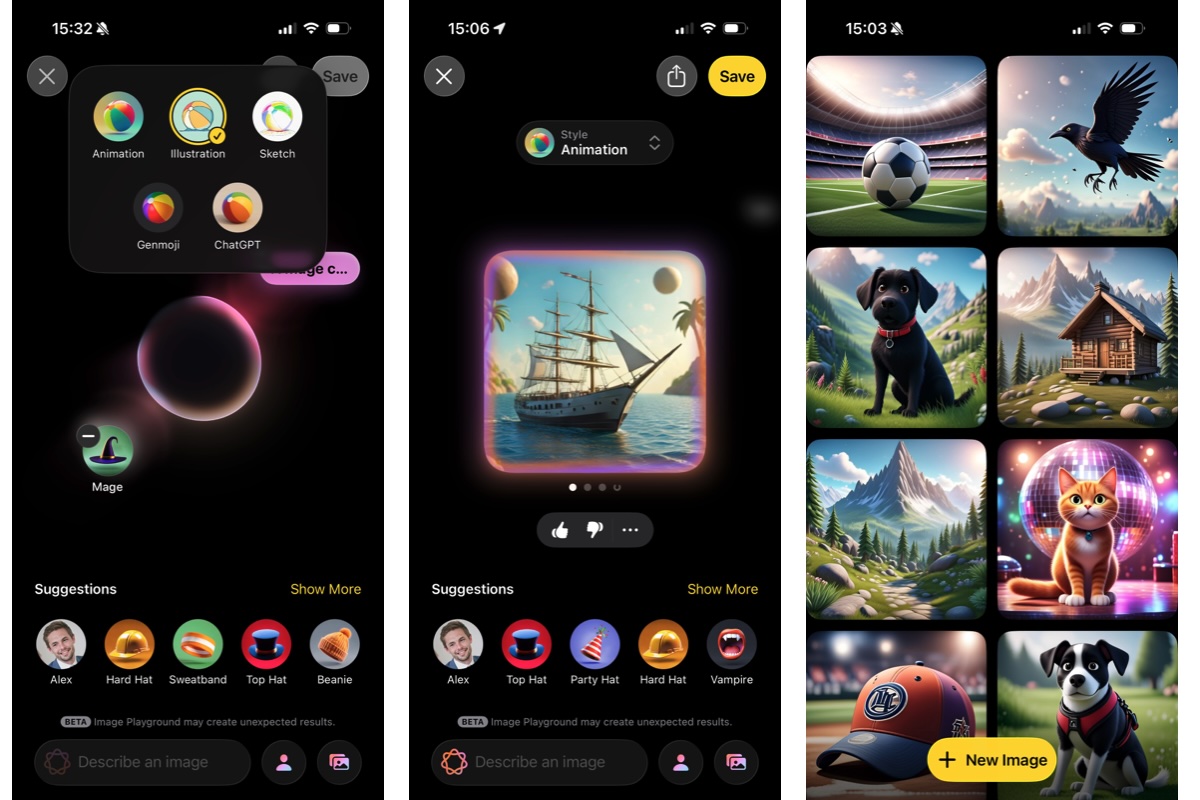
Using Image Playground
.
Foundry
New features in Image Playground in iOS 26
The Image Playground app gains a few new features in iOS 26. For instance, you can use ChatGPT’s image generation capabilities alongside Apple’s, and there are a few new styles to choose from.
Image Playground is also able to create new Genmoji or combine existing emoji together. After creating a Genmoji, tap Add Emoji to use it in apps like Messages.
How to use Apple Intelligence with Siri
Siri has long lagged behind other virtual assistants, but the addition of Apple Intelligence gives it a much-needed shot in the arm.
Here’s how to put it to good use:
- Use Type to Siri by double-tapping the bottom of your screen, then typing your request.
- To turn this off, go to Settings > Apple Intelligence & Siri > Talk & Type to Siri, then turn off the toggle next to Type to Siri.
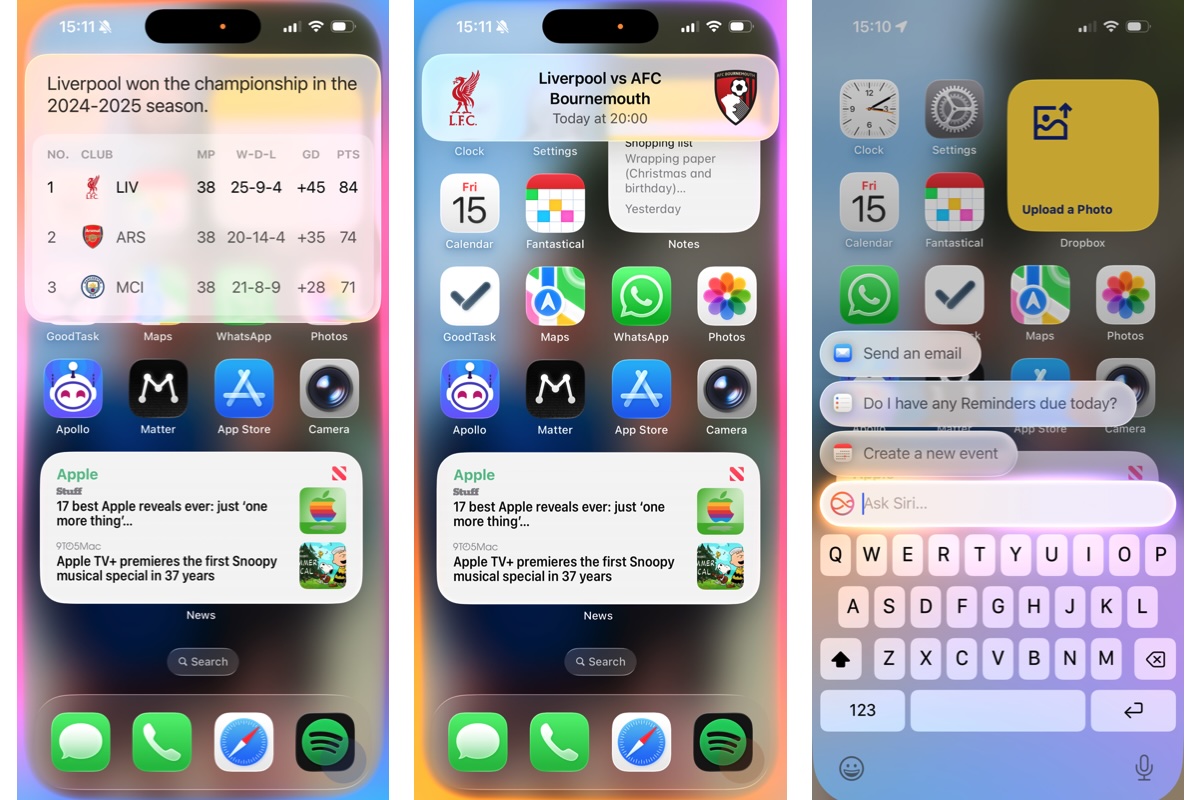
- You can also make requests that maintain context. To see that in action, first ask Siri a question, then ask a follow-up question right after. For instance, try asking “Who won the Premier League last season?”
- Once you have your answer, follow it up with “When are they playing next?” Siri will know you’re talking about last year’s Premier League winner and will show you the date and opponent for their next game.
Apple Intelligence and Siri
.
Foundry
Apple says that Apple Intelligence will bring a lot more to Siri, such as the ability to control apps in granular detail and perform tasks based on your personal context, but those tools aren’t here yet. According to Apple, they should arrive in 2026.
How to use Apple Intelligence to help you focus
Apple Intelligence’s analysis tools can filter out distractions and keep you focused.
The Reduce Interruptions Focus cuts out all notifications except those that Apple Intelligence deems to be the most important.
- Go to Settings > Focus.
- Tap +.
- Tap Reduce Interruptions.
- Pick which apps and people can break through the Focus (if any) or tap Options to customize the mode further.
- You can also link it to a specific Lock Screen or Home Screen, set the Focus to a schedule, and customize how specific apps behave when the Focus is active.
How to use AI to summarize notifications
Apple Intelligence’s generative abilities allow it to sum up your notifications:
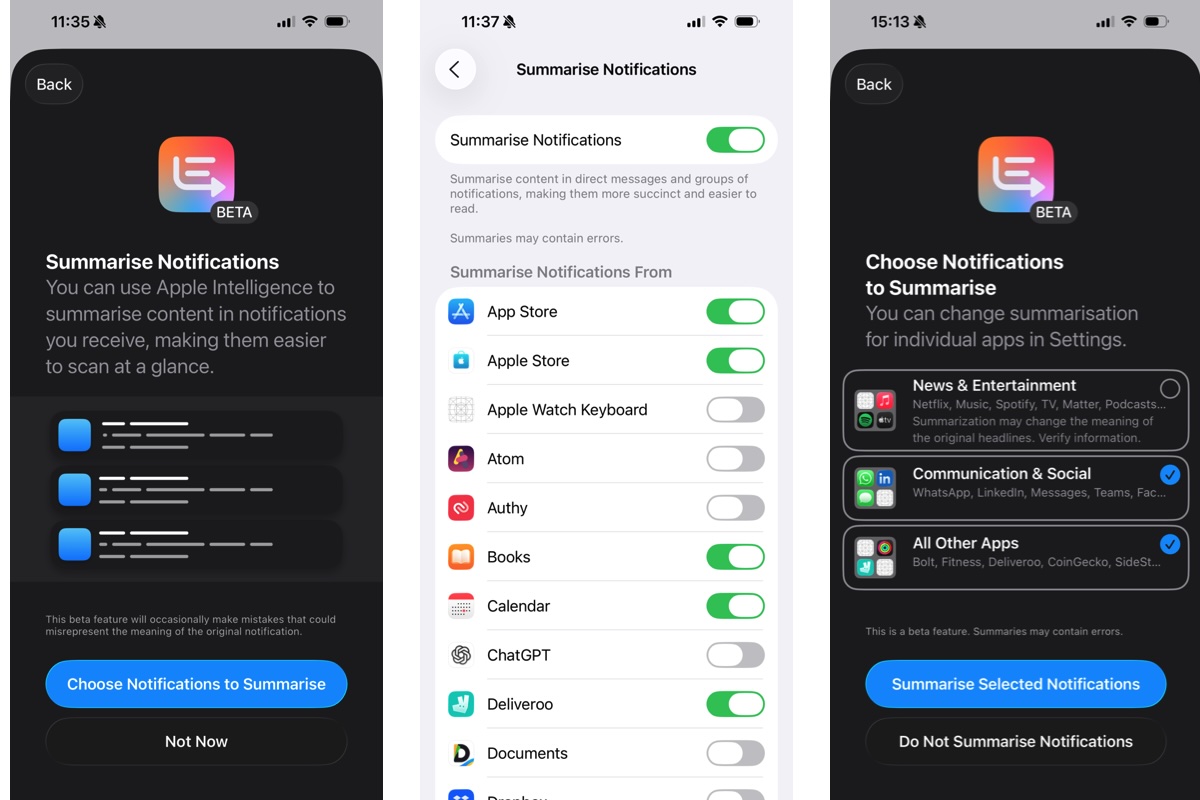
- Go to Settings > Notifications > Summarize Notifications, then turn on the toggle next to Summarize Notifications.
- Tap “Choose Notifications to Summarize,” then pick any categories you like and select “Summarize Selected Notifications.”
- Tap the toggle next to any app whose notifications you want Apple Intelligence to summarize.
Apple Intelligence to Summarize Notifications
.
Foundry
How to use Apple Intelligence to prioritise your notifications
With the Prioritize Notifications aspect of Apple Intelligence, your most important alerts and notifications will be highlighted on your Lock Screen:
- Head to Settings > Notifications > Prioritize Notifications.
- Turn on the toggle next to Prioritize Notifications, then pick the apps whose alerts you want to be prioritized. This will float them to the top of your alert stack and highlight them to make them more noticeable.
- When a prioritized notification appears on your Lock Screen, you can turn off priority for that app by swiping left, tapping Options, then selecting Turn Off All [app name] Notifications.
- To disable priority notifications for all apps, swipe left, tap Options, then tap “Turn Off Prioritization.”
How to use visual intelligence on iPhone
Visual intelligence combines Apple Intelligence with your camera app. Just point your camera at something and Apple Intelligence can tell you what it is, add an event to your calendar, summarize text, and more.
- Press and hold the Camera Control button (iPhone 15 Pro or later). This opens the Visual Intelligence window.
- Now point your camera at an object or a body of text.
- Press the Camera Control again to snap a picture.
- Open the image.
Foundry
What visual intelligence can do
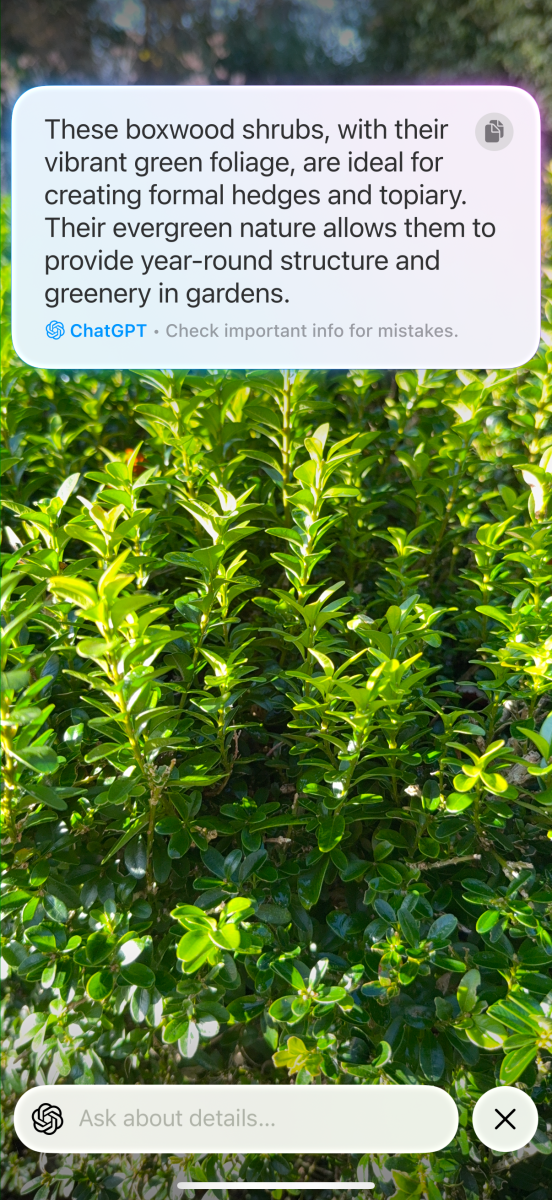
- If it’s a plant or animal, you might see a prompt at the bottom of the screen that identifies it. Tap this prompt to get more information.
- If you show visual intelligence a place of business, it might be able to identify what it is. If it does, tap the name of the business, then tap Schedule to see its opening hours, Order to place a delivery order, Menu to see what’s on offer, or Reserve to book a table. To call the business or visit its website, tap the … button.
- If visual intelligence sees a poster advertising an event, tap Create Event > Schedule to add it to your calendar.
- Visual intelligence will also give you options to summarize text, translate it, or read it aloud.
- If either a phone number, date, website, or email address is present, you can interact with that too.
- Whatever you use visual intelligence for, you can hand over to ChatGPT by tapping the speech bubble icon. This also lets you ask a follow-up question, if you like.
- By tapping the landscape icon in the bottom-right corner, you can search Google for similar images.
Visual intelligence updates in iOS 26
In iOS 26, visual intelligence will be able to work with screenshots and other images already on your device, not just what it sees through your camera
- Take a screenshot.
- Tap the Ask button to get ChatGPT to explain what it sees.
- Alternatively, take a screenshot and tap Search to ask Google or other websites (like Etsy) what the image depicts.
- You can also use a finger to highlight an aspect of the image, then tap Search to get results for only that specific element.
Read: How to use Visual Intelligence to analyse sceenshots
How to use Apple Intelligence in other apps
Because Apple Intelligence is a system-wide tool, you can find it in many other places within iOS. That includes several of Apple’s own apps, as we’ll show below.
How to use Apple Intelligence in Mail
You can set up Mail so that it displays only the messages that Apple Intelligence thinks are significant at the top of your inbox.
- Open the Mail app, tap the … button.
- Tap Show Priority to see prioritized emails.
When you’re replying to a message, you can use a message suggested by Apple Intelligence by picking one from the top of your keyboard.
In your inbox, you can see a short summary under each message.
- Tap an email.
- Then tap Summarize (you might need to scroll to the top of the email to see this) to get Apple Intelligence to sum up the message.
How to use Apple Intelligence in Messages
Apple Intelligence has similar summary and Smart Reply tools in the Messages app.
In your list of text messages, you’ll see a summary of unread posts under each conversation
- To send a Smart Reply, open a conversation.
- Tap the text field.
- Pick a suggested reply from your keyboard.
- You can further refine these generated replies using Writing Tools (more information below).
How to use Apple Intelligence in Notes
In the Notes app, Apple Intelligence can be used to transcribe audio.
- Open a note that contains a recording (you can add a Voice Memo to notes by tapping on the … and choosing Share and Notes).
- Tap the recording, then select Summary.
- You can also do this with recorded phone calls, which are saved to the Notes app (they’re saved to the Call Recordings folder within the app).
How to use Apple Intelligence in Photos

How to use Apple Intelligence in Photos.
Foundry
The Photos app uses Apple Intelligence in several different ways, from editing your images to creating memory montages
To find images, tap the search box and enter your search terms using natural language, such as “Maya skateboarding in a tie-dye shirt”
Create a custom memory movie by scrolling to the Memories section in the Collections tab and tapping Create, then entering your description.
The Clean Up tool can remove distractions from your images.
- Open a photo and tap the edit button (it looks like three toggles).
- Tap Clean Up.
- Tap, brush or circle over anything you want Apple Intelligence to remove. If you brush over a person’s face, Photos might use a pixelated mosaic effect to protect their identity. Use pinch to zoom in if needed.
How to use Apple Intelligence in Safari
Safari can summarize web pages and create a contents list for you, all using Apple Intelligence:
- To summarize a web page, tap the Reader view in the URL bar, then tap Summary at the top of the page.
- Alternatively, tap the Reader view, then tap Table of Contents. From here, tap a list entry to be taken to the relevant part of the page.
- You can also choose for Siri to read the page for you, just tap on Listen to Page.
How to use ChatGPT with Apple Intelligence
Apple Intelligence can do a lot, but there are places where ChatGPT is more capable. But you don’t need to drop Apple Intelligence and open a browser or app to use ChatGPT – it’s actually integrated into Apple Intelligence.
How to use ChatGPT on iPhone
- Go to Settings > Apple Intelligence & Siri.
- Choose ChatGPT > Set Up.
- Follow the on-screen instructions.
You can use ChatGPT with or without an account, but requests will only be saved to your ChatGPT account if you’re signed in.
For more help read our dedicated how-to on ChaptGPT in Apple Intelligence.
ChatGPT integrates well with Siri. To use it, do the following:
- Ask Siri a question. If Siri is not sure of the answer, you’ll see a text box asking if you want to switch to ChatGPT
- Tap Use ChatGPT and Siri will give you an answer sourced from OpenAI’s chatbot. (To use ChatGPT without these permission requests, go to Settings > Apple Intelligence & Siri > ChatGPT, then tap to turn off Confirm Requests)
- You can be more specific in order to invoke ChatGPT, for example by saying “Hey Siri, ask ChatGPT to compose a haiku about dragons.”
- You can include documents and files, too. If you have something open in the Files app, for instance, you can say “Hey Siri, ask ChatGPT to summarize this document for me.” You’ll be asked to confirm if you’re happy for your files or images to be sent to ChatGPT
How to turn off ChatGPT on iPhone
If you want to turn off ChatGPT completely, that’s simple enough:
- Go to Settings > Screen Time > Content & Privacy Restrictions.
- Enable the toggle next to Content & Privacy Restrictions.
- Now scroll down and go to Intelligence & Siri > Intelligence Extensions > Don’t Allow.
New Apple Intelligence features in iOS 26
The iOS 26 update is bringing a wide array of new features to Apple Intelligence in addition to those mentioned above. Here, are some of the most important ones.
Live Translation in iOS 26
Sick of things getting lost in translation? Apple Intelligence will be able to translate both text and voices on the fly in iOS 26
- In a Messages conversation, tap a person’s name, enable Automatically Translate.
- Pick the chosen language for both the sender and the recipient so Apple Intelligence knows what it’s working with
- Messages will now show both the original language and the translated text
Live Translation also works for voices in the Phone and FaceTime apps. In the former, you’ll get an AI-generated voice speaking in your native tongue, plus a translated transcript. In FaceTime, you just get the transcript. Note that both users need to have a Live Translation-compatible device running iOS 26 for voice translation to work.
Shortcuts in iOS 26
The Shortcuts app has been supercharged by the addition of Apple Intelligence. That means in iOS 26 you can integrate Apple Intelligence actions into your shortcuts, for example by creating an image using Image Playground, adjusting text with Writing Tools, or pulling in data from other apps on your device (such as Weather or Calendar).
Additionally, Shortcuts will let you choose between using Apple Intelligence, Apple’s Private Cloud Compute, or ChatGPT for some requests.
Wallet order tracking in iOS 26
The Wallet app can keep track of your orders in iOS 26 thanks to Apple Intelligence
- It does so by scanning your emails to find orders and tracking details
- To enable this, open the Wallet app, tap the … button
- Then select Orders > Allow
- Tap an order to see information on the seller, order number, tracking number, and more
- You can also see the email that the data came from – tap it to open it in the Mail app


