Moving to a walkable city can add 1,100 steps to your day

February 17, 2026
2 min reading
 Add us on GoogleAdd SciAm
Your daily steps may depend more on your zip code than your willpower
Researchers found that walkable city design, not personal motivation, was the key factor that pushed people to take an extra 1,100 steps per day.

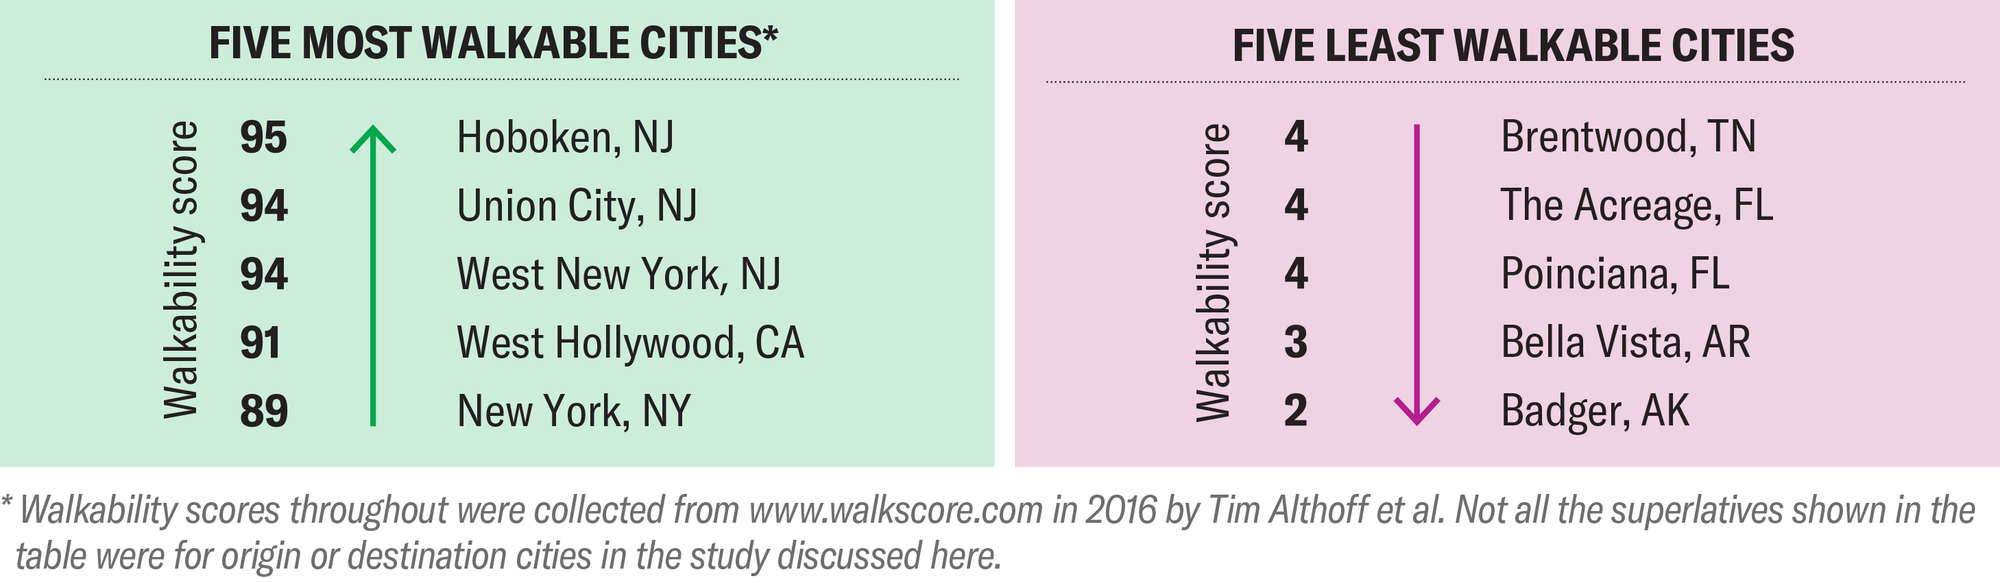
A neighborhood’s walkability is a bit of a chicken-and-egg problem: Does living in a walkable city make you walk more, or do active people choose to live where it’s easier to walk? To investigate, researchers analyzed smartphone data between 2013 and 2016 for two million people, including more than 5,000 people moving between more than 1,600 U.S. cities. Tim Althoff, a computer scientist at the University of Washington, and his colleagues found that after moving to more walkable cities, people took about 1,100 more steps per day, which equates to 11 minutes of additional daily walking. What’s more intriguing is that these extra steps were part of brisk walks, a physical activity that improves health and could help reduce the risk of death anywhere. Meanwhile, the data showed that people who moved between cities with similar walkability did not change their activity levels. The findings suggest that built environments, rather than personal choice alone, could affect not only the quantity but also the intensity of exercise their residents get.


On supporting science journalism
If you enjoy this article, please consider supporting our award-winning journalism by subscription. By purchasing a subscription, you are helping to ensure the future of impactful stories about the discoveries and ideas shaping our world today.
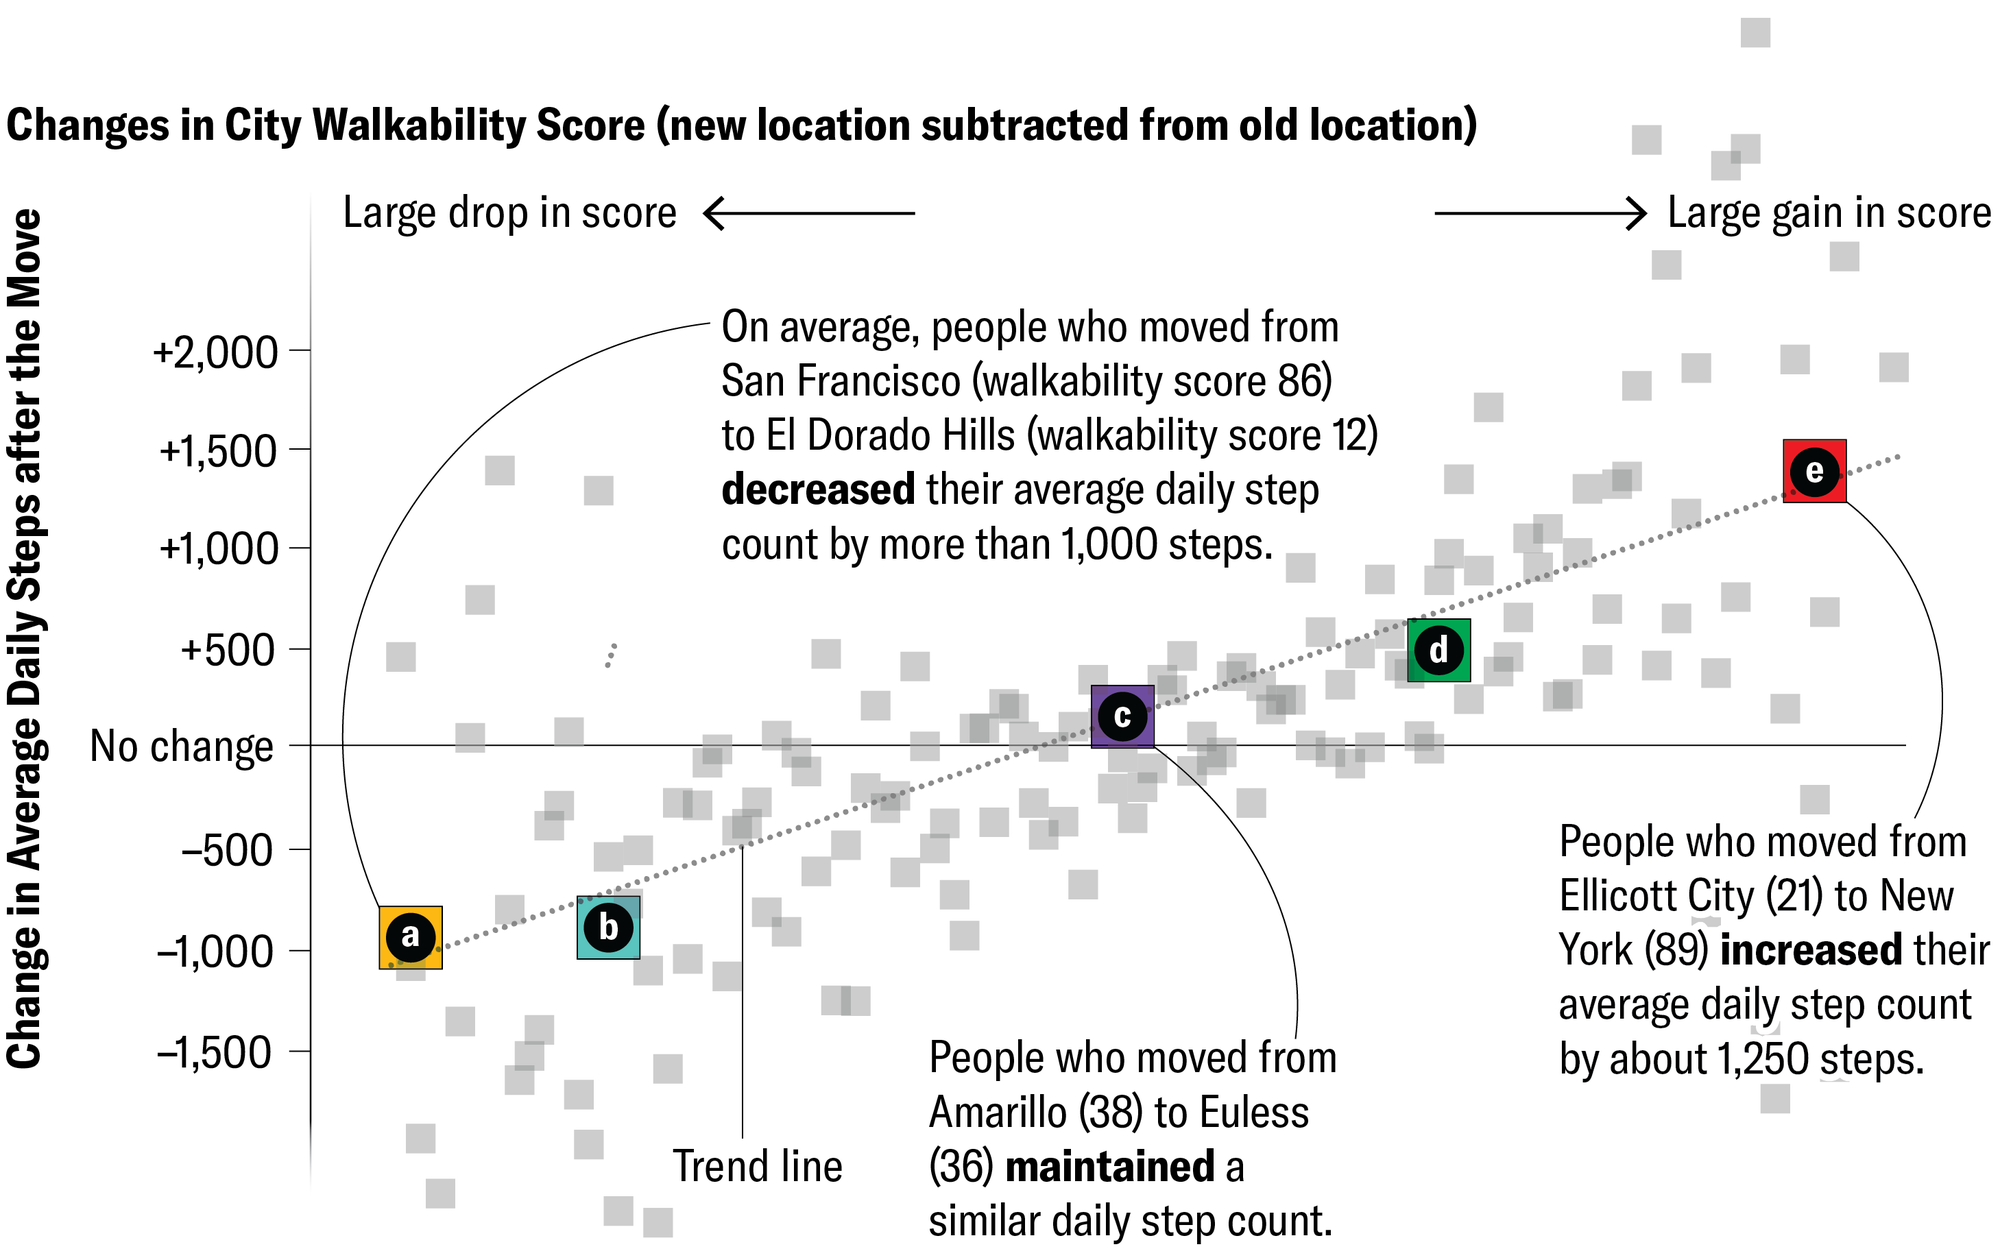
MORE FEET, MORE STEPS
Each square represents a pair of relocation cities. One axis shows the evolution of the city’s pedestrian potential, and the other axis shows the evolution of the number of daily steps. Those who moved to more walkable cities added about 1,100 steps per day, and those who moved to less walkable places reduced their activity by a similar amount.
WHAT IF ALL CITIES IN THE UNITED STATES WALK LIKE NEW YORK AND CHICAGO?
If all U.S. cities had the Chicago Walk Score of 78, the average person would take 443 more steps per day and gain 24 additional minutes of moderate-to-vigorous physical activity per week: enough for 11.2 percent of people, or 36 million more Americans, to meet the aerobic activity guideline goals. And if everyone walked like New Yorkers, an even larger share — 14.5 percent, or about 47 million people — would achieve those goals.

It’s time to defend science
If you enjoyed this article, I would like to ask for your support. Scientific American has been defending science and industry for 180 years, and we are currently experiencing perhaps the most critical moment in these two centuries of history.
I was a Scientific American subscriber since the age of 12, and it helped shape the way I see the world. SciAm always educates and delights me, and inspires a sense of respect for our vast and beautiful universe. I hope this is the case for you too.
If you subscribe to Scientific Americanyou help ensure our coverage centers on meaningful research and discoveries; that we have the resources to account for decisions that threaten laboratories across the United States; and that we support budding and working scientists at a time when the value of science itself too often goes unrecognized.
In exchange, you receive essential information, captivating podcasts, brilliant infographics, newsletters not to be missed, unmissable videos, stimulating games and the best writings and reports from the scientific world. You can even offer a subscription to someone.
There has never been a more important time for us to stand up and show why science matters. I hope you will support us in this mission.


